4808 NE 259th St Ridgefield, WA 98642
Estimated Value: $1,215,000 - $2,076,000
4
Beds
4
Baths
4,583
Sq Ft
$373/Sq Ft
Est. Value
About This Home
This home is located at 4808 NE 259th St, Ridgefield, WA 98642 and is currently estimated at $1,709,319, approximately $372 per square foot. 4808 NE 259th St is a home located in Clark County with nearby schools including Ridgefield High School, Mountain View Christian School, and Cedar Tree Classical Christian School.
Ownership History
Date
Name
Owned For
Owner Type
Purchase Details
Closed on
Jan 30, 2015
Sold by
Lemmon Mark W and Lemmon Annette L
Bought by
Mark W & Annette L Lemmon Family Revocab and Lemmon Annette Lee
Current Estimated Value
Purchase Details
Closed on
Sep 24, 2007
Sold by
Bartley David A and Bartley Laura M
Bought by
Lemmon Mark W and Lemmon Annette L
Purchase Details
Closed on
Mar 6, 2000
Sold by
Lee Kenny Q and Lee Marie Schaeffer
Bought by
Bartley David A and Bartley Laura M
Purchase Details
Closed on
Mar 1, 2000
Sold by
Lee Peter Q
Bought by
Lee Kenny Q and Lee Marie Schaeffer
Purchase Details
Closed on
Jun 4, 1997
Sold by
Keesling Claude G and Keesling Lou E
Bought by
Lee Peter Q
Create a Home Valuation Report for This Property
The Home Valuation Report is an in-depth analysis detailing your home's value as well as a comparison with similar homes in the area
Home Values in the Area
Average Home Value in this Area
Purchase History
| Date | Buyer | Sale Price | Title Company |
|---|---|---|---|
| Mark W & Annette L Lemmon Family Revocab | -- | None Available | |
| Lemmon Mark W | $925,000 | Stewart Title | |
| Bartley David A | -- | Clark County Title Company | |
| Lee Kenny Q | -- | Clark County Title Company | |
| Lee Peter Q | -- | Chicago Title Insurance |
Source: Public Records
Tax History Compared to Growth
Tax History
| Year | Tax Paid | Tax Assessment Tax Assessment Total Assessment is a certain percentage of the fair market value that is determined by local assessors to be the total taxable value of land and additions on the property. | Land | Improvement |
|---|---|---|---|---|
| 2025 | $15,697 | $1,798,695 | $258,287 | $1,540,408 |
| 2024 | $15,459 | $1,680,421 | $258,287 | $1,422,134 |
| 2023 | $15,628 | $1,764,036 | $258,287 | $1,505,749 |
| 2022 | $14,178 | $1,711,104 | $299,440 | $1,411,664 |
| 2021 | $13,998 | $1,447,929 | $274,946 | $1,172,983 |
| 2020 | $13,683 | $1,336,145 | $239,021 | $1,097,124 |
| 2019 | $13,687 | $1,286,393 | $224,323 | $1,062,070 |
| 2018 | $13,455 | $1,313,914 | $0 | $0 |
| 2017 | $11,927 | $1,117,535 | $0 | $0 |
| 2016 | $10,206 | $1,161,857 | $0 | $0 |
| 2015 | $10,235 | $950,474 | $0 | $0 |
| 2014 | -- | $910,806 | $0 | $0 |
| 2013 | -- | $874,538 | $0 | $0 |
Source: Public Records
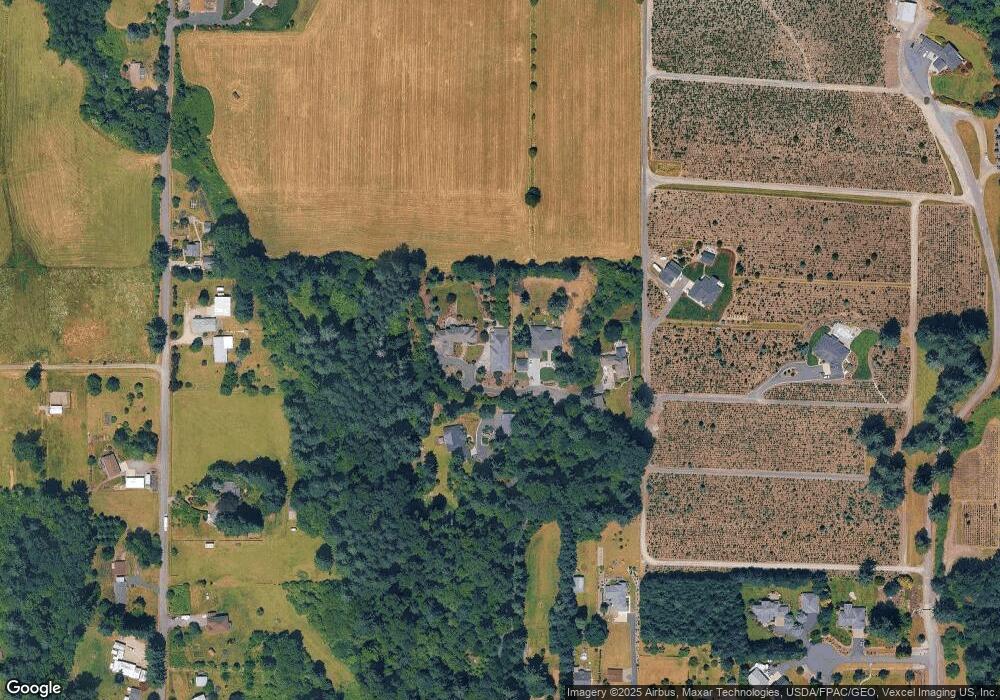
Map
Nearby Homes
- 24909 NE 29th Ave
- 7003 NE 279th St
- 2207 NE 259th St
- 5911 NE 289th St
- 26619 NE 77th Ave
- 208 S 93rd Place Unit 108
- 200 S 93rd Place Unit 107
- 2115 NE 279th St
- 9203 S 3rd St Unit 113
- 9121 S 3rd St Unit 115
- 28306 NE 24th Ave
- 9023 S 2nd Ln Unit 125
- 2001 NE 279th St
- 2504 NE 240th St
- 502 N 91st Ave Unit 259
- 400 N 91st Ave Unit 256
- 408 N 91st Ave Unit 257
- 5819 NE 295th St
- 8110 NE 272nd Cir
- 232 S 89th Place Unit 28
- 4810 NE 259th St
- 4800 NE 259th St
- 5002 NE 263rd St
- 26217 NE 45th Ave
- 0 NE 265th St
- 26403 NE 45th Ave
- 26115 NE 45th Ave
- 26201 NE 51st Ct
- 4900 NE 259th St
- 26112 NE 45th Ave
- 26007 NE 45th Ave
- 4816 NE 259th St
- 26713 NE 45th Ave
- 4908 NE 259th St
- 26108 NE 45th Ave
- 5200 NE 259th Cir
- 26504 NE 51st Ct
- 5012 NE 259th St