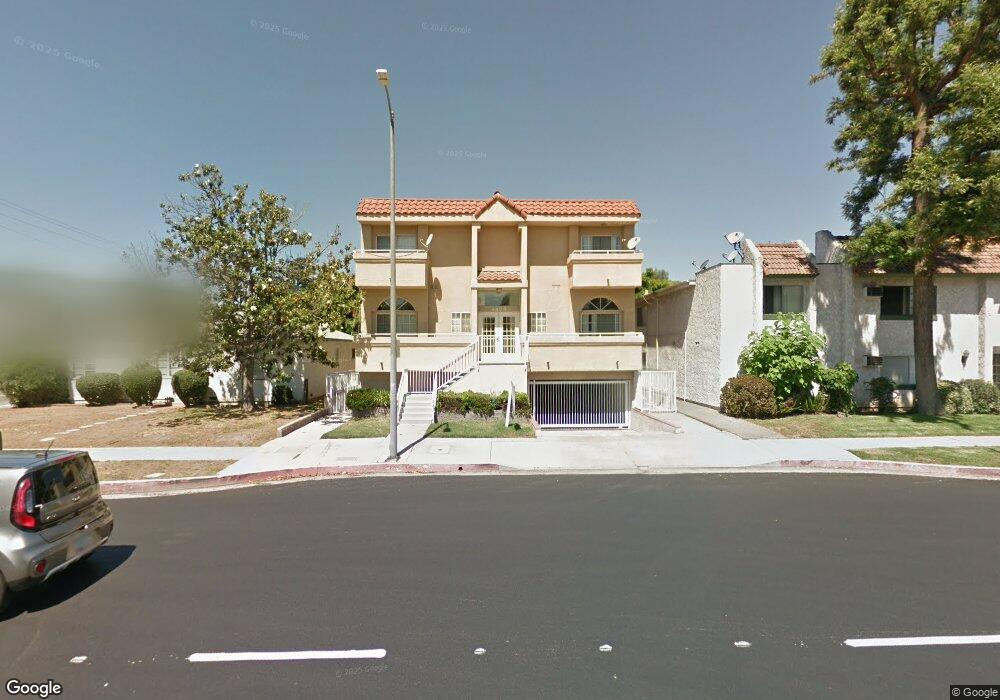
4809 Kester Ave Unit 1 Sherman Oaks, CA 91403
Estimated Value: $567,000 - $871,000
2
Beds
3
Baths
1,121
Sq Ft
$601/Sq Ft
Est. Value
About This Home
This home is located at 4809 Kester Ave Unit 1, Sherman Oaks, CA 91403 and is currently estimated at $674,223, approximately $601 per square foot. 4809 Kester Ave Unit 1 is a home located in Los Angeles County with nearby schools including Kester Avenue Elementary School, Van Nuys High School, and Sherman Oaks Elementary Charter School.
Ownership History
Date
Name
Owned For
Owner Type
Purchase Details
Closed on
Aug 23, 2023
Sold by
Der Danielian Family Trust and Der Danielian Valodia
Bought by
Der Danielian Family Trust and Der Danielian
Current Estimated Value
Home Financials for this Owner
Home Financials are based on the most recent Mortgage that was taken out on this home.
Original Mortgage
$303,000
Outstanding Balance
$296,096
Interest Rate
6.81%
Mortgage Type
Credit Line Revolving
Estimated Equity
$378,127
Purchase Details
Closed on
Sep 12, 2003
Sold by
Derdanielian Valodia and Derdanielian Diana
Bought by
The Der Danielian Family Trust
Purchase Details
Closed on
Jan 2, 2001
Sold by
Amirkhanian Norair
Bought by
Derdanielian Valodia
Purchase Details
Closed on
Apr 5, 2000
Sold by
Amirkhanian Norair
Bought by
Derdanielian Valodia
Purchase Details
Closed on
Jan 11, 2000
Sold by
Sanoyans Wilson
Bought by
Amirkhanian Norair
Create a Home Valuation Report for This Property
The Home Valuation Report is an in-depth analysis detailing your home's value as well as a comparison with similar homes in the area
Home Values in the Area
Average Home Value in this Area
Purchase History
| Date | Buyer | Sale Price | Title Company |
|---|---|---|---|
| Der Danielian Family Trust | -- | Chicago Title Company | |
| The Der Danielian Family Trust | -- | -- | |
| Derdanielian Valodia | $228,500 | Investors Title Company | |
| Derdanielian Valodia | -- | Investors Title Company | |
| Amirkhanian Norair | -- | Investors Title Company |
Source: Public Records
Mortgage History
| Date | Status | Borrower | Loan Amount |
|---|---|---|---|
| Open | Der Danielian Family Trust | $303,000 |
Source: Public Records
Tax History Compared to Growth
Tax History
| Year | Tax Paid | Tax Assessment Tax Assessment Total Assessment is a certain percentage of the fair market value that is determined by local assessors to be the total taxable value of land and additions on the property. | Land | Improvement |
|---|---|---|---|---|
| 2025 | $3,539 | $287,200 | $81,587 | $205,613 |
| 2024 | $3,539 | $281,570 | $79,988 | $201,582 |
| 2023 | $3,472 | $276,050 | $78,420 | $197,630 |
| 2022 | $3,310 | $270,638 | $76,883 | $193,755 |
| 2021 | $3,265 | $265,332 | $75,376 | $189,956 |
| 2019 | $3,168 | $257,465 | $73,142 | $184,323 |
| 2018 | $3,149 | $252,417 | $71,708 | $180,709 |
| 2016 | $3,002 | $242,617 | $68,924 | $173,693 |
| 2015 | $2,959 | $238,973 | $67,889 | $171,084 |
| 2014 | $2,974 | $234,293 | $66,560 | $167,733 |
Source: Public Records
Map
Nearby Homes
- 4724 Kester Ave Unit 404
- 4705 Kester Ave Unit 209
- 4707 Willis Ave Unit 110
- 4664 Lemona Ave
- 14812 Morrison St
- 15123 Camarillo St
- 4551 Kester Ave Unit 1
- 4573 Willis Ave
- 14822 Hesby St
- 14923 Moorpark St Unit 103
- 4553 Willis Ave
- 4615 Cedros Ave
- 14655 Morrison St
- 4542 Willis Ave Unit 206
- 15027 Ventura Blvd
- 14738 Otsego St
- 5115 Kester Ave Unit 14
- 4501 Cedros Ave Unit 336
- 4501 Cedros Ave Unit 338
- 4501 Cedros Ave Unit 308
- 4809 Kester Ave
- 4809 Kester Ave Unit 6
- 4809 Kester Ave Unit 5
- 4809 Kester Ave Unit 4
- 4809 Kester Ave Unit 3
- 4809 Kester Ave Unit 2
- 4803 Kester Ave
- 4806 Saloma Ave
- 4802 Saloma Ave
- 4812 Saloma Ave
- 4765 Kester Ave
- 4818 Saloma Ave
- 4764 Saloma Ave
- 14920 Camarillo St
- 4824 Saloma Ave
- 4770 Kester Ave
- 4758 Saloma Ave
- 4753 Kester Ave
- 4829 Saloma Ave
- 4831 Saloma Ave