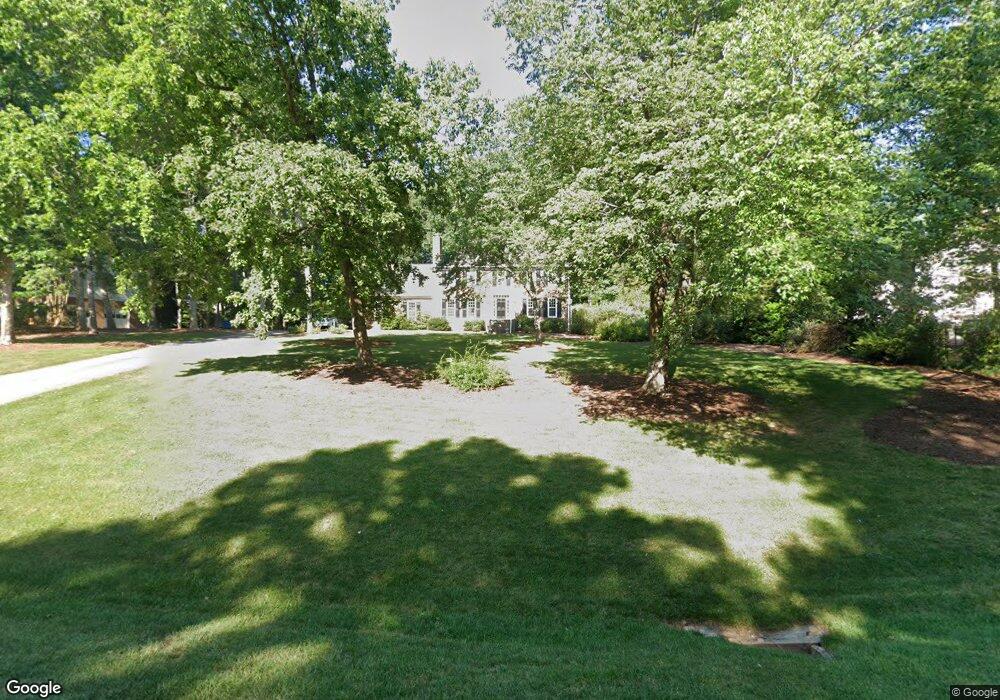
4809 Oak Way Raleigh, NC 27613
Wood Valley NeighborhoodEstimated Value: $820,752 - $896,000
4
Beds
3
Baths
3,339
Sq Ft
$257/Sq Ft
Est. Value
About This Home
This home is located at 4809 Oak Way, Raleigh, NC 27613 and is currently estimated at $859,188, approximately $257 per square foot. 4809 Oak Way is a home located in Wake County with nearby schools including Leesville Road Middle School, Leesville Road High School, and Quest Academy.
Ownership History
Date
Name
Owned For
Owner Type
Purchase Details
Closed on
Oct 31, 2008
Sold by
Hall Gregory J and Hall Teresa S
Bought by
Klecha Jacek J and Klecha Kristen L
Current Estimated Value
Home Financials for this Owner
Home Financials are based on the most recent Mortgage that was taken out on this home.
Original Mortgage
$366,400
Outstanding Balance
$235,916
Interest Rate
5.78%
Mortgage Type
Purchase Money Mortgage
Estimated Equity
$623,272
Purchase Details
Closed on
Jul 31, 2003
Sold by
The Revocable Living Trust Of Dennis & J
Bought by
Hall Gregory J and Hall Teresa S
Home Financials for this Owner
Home Financials are based on the most recent Mortgage that was taken out on this home.
Original Mortgage
$290,400
Interest Rate
5.17%
Mortgage Type
Purchase Money Mortgage
Purchase Details
Closed on
May 6, 2002
Sold by
Paro Dennis J and Paro Janet M
Bought by
Revocable Living Trust Dennis & Janet Pa
Create a Home Valuation Report for This Property
The Home Valuation Report is an in-depth analysis detailing your home's value as well as a comparison with similar homes in the area
Home Values in the Area
Average Home Value in this Area
Purchase History
| Date | Buyer | Sale Price | Title Company |
|---|---|---|---|
| Klecha Jacek J | $458,000 | None Available | |
| Hall Gregory J | $363,000 | -- | |
| Revocable Living Trust Dennis & Janet Pa | -- | -- |
Source: Public Records
Mortgage History
| Date | Status | Borrower | Loan Amount |
|---|---|---|---|
| Open | Klecha Jacek J | $366,400 | |
| Closed | Klecha Jacek J | $68,700 | |
| Previous Owner | Hall Gregory J | $290,400 | |
| Closed | Hall Gregory J | $54,400 |
Source: Public Records
Tax History Compared to Growth
Tax History
| Year | Tax Paid | Tax Assessment Tax Assessment Total Assessment is a certain percentage of the fair market value that is determined by local assessors to be the total taxable value of land and additions on the property. | Land | Improvement |
|---|---|---|---|---|
| 2025 | $4,847 | $754,720 | $210,000 | $544,720 |
| 2024 | $4,707 | $754,720 | $210,000 | $544,720 |
| 2023 | $3,809 | $485,947 | $135,000 | $350,947 |
| 2022 | $3,530 | $485,947 | $135,000 | $350,947 |
| 2021 | $3,435 | $485,947 | $135,000 | $350,947 |
| 2020 | $3,378 | $485,947 | $135,000 | $350,947 |
| 2019 | $3,370 | $410,163 | $135,000 | $275,163 |
| 2018 | $3,019 | $399,637 | $135,000 | $264,637 |
| 2017 | $2,861 | $399,637 | $135,000 | $264,637 |
| 2016 | $2,803 | $399,637 | $135,000 | $264,637 |
| 2015 | $2,728 | $389,928 | $122,000 | $267,928 |
| 2014 | $2,586 | $389,928 | $122,000 | $267,928 |
Source: Public Records
Map
Nearby Homes
- 5009 Wood Valley Dr
- 4820 Sandberry Ln
- 10729 Winding Wood Trail
- 5020 Celbridge Place
- 8717 Little Deer Ln
- 11804 Mountbatten Way
- 10305 Old Creedmoor Rd
- 5528 Hawthorne Park
- 10109 Goodview Ct
- 12909 Baybriar Dr
- 10101 Lobley Hill Ln
- 11953 Eagle Cliff Ct
- 5020 Red Cedar Rd
- 8802 Fidelis Ln
- Harlow Plan at Bayberry
- 9309 Field Maple Ct
- 9305 Field Maple Ct
- 7942 Berry Crest Ave
- 5965 Dunbarton Way
- 12304 Whartons Way
- 4805 Oak Way
- 4813 Oak Way
- 10612 Bent Twig Dr
- 4812 Oak Way
- 4808 Oak Way
- 4804 Wood Valley Dr
- 4816 Oak Way
- 4801 Oak Way
- 4804 Oak Way
- 4808 Wood Valley Dr
- 4821 Oak Way
- 4820 Oak Way
- 5417 Oak Way
- 10608 Bent Twig Dr
- 4724 Wood Valley Dr
- 4812 Wood Valley Dr
- 4825 Oak Way
- 10613 Bent Twig Dr
- 4801 Wood Valley Dr
- 10604 Bent Twig Dr