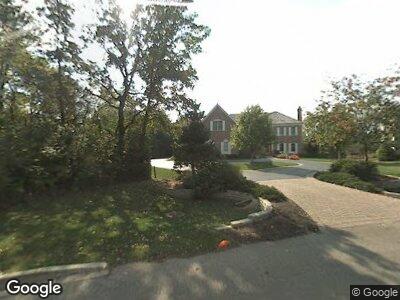
4809 Preserve Pkwy Long Grove, IL 60047
Estimated Value: $1,079,931 - $1,542,000
4
Beds
5
Baths
4,700
Sq Ft
$266/Sq Ft
Est. Value
About This Home
This home is located at 4809 Preserve Pkwy, Long Grove, IL 60047 and is currently estimated at $1,247,983, approximately $265 per square foot. 4809 Preserve Pkwy is a home located in Lake County with nearby schools including Country Meadows Elementary School, Woodlawn Middle School, and Adlai E Stevenson High School.
Ownership History
Date
Name
Owned For
Owner Type
Purchase Details
Closed on
May 25, 2016
Sold by
Fishbein Daniel A and Fishbein Stacey E
Bought by
Fishbein Stacey E and Fishben Daniel A
Current Estimated Value
Purchase Details
Closed on
Dec 18, 2009
Sold by
Pinello Phillip A and Pinello Lisa A
Bought by
Pinello Phillip A
Purchase Details
Closed on
Nov 29, 2004
Sold by
Pinello Phillip A
Bought by
Pinello Phillip A and Pinello Lisa A
Purchase Details
Closed on
Feb 14, 2001
Sold by
Toll Il Lp
Bought by
Pinello Phillip A
Home Financials for this Owner
Home Financials are based on the most recent Mortgage that was taken out on this home.
Original Mortgage
$200,000
Interest Rate
6.91%
Create a Home Valuation Report for This Property
The Home Valuation Report is an in-depth analysis detailing your home's value as well as a comparison with similar homes in the area
Home Values in the Area
Average Home Value in this Area
Purchase History
| Date | Buyer | Sale Price | Title Company |
|---|---|---|---|
| Fishbein Stacey E | -- | Attorney | |
| Pinello Phillip A | -- | None Available | |
| Pinello Phillip A | -- | -- | |
| Pinello Phillip A | $943,500 | 1St American Title |
Source: Public Records
Mortgage History
| Date | Status | Borrower | Loan Amount |
|---|---|---|---|
| Open | Fishbein Daniel | $80,000 | |
| Closed | Fishbein Stacey | $51,500 | |
| Closed | Fishbein Daniel | $36,368 | |
| Open | Fishbein Daniel A | $411,000 | |
| Closed | Fishbein Daniel | $417,000 | |
| Closed | Fishbein Daniel | $183,000 | |
| Closed | Pinello Phillip A | $200,000 |
Source: Public Records
Tax History Compared to Growth
Tax History
| Year | Tax Paid | Tax Assessment Tax Assessment Total Assessment is a certain percentage of the fair market value that is determined by local assessors to be the total taxable value of land and additions on the property. | Land | Improvement |
|---|---|---|---|---|
| 2024 | $22,770 | $263,789 | $70,557 | $193,232 |
| 2023 | $21,719 | $248,905 | $66,576 | $182,329 |
| 2022 | $21,719 | $236,131 | $63,159 | $172,972 |
| 2021 | $20,970 | $233,585 | $62,478 | $171,107 |
| 2020 | $20,511 | $234,382 | $62,691 | $171,691 |
| 2019 | $23,001 | $268,354 | $62,460 | $205,894 |
| 2018 | $23,537 | $283,037 | $67,898 | $215,139 |
| 2017 | $23,147 | $276,430 | $66,313 | $210,117 |
| 2016 | $22,312 | $269,717 | $63,500 | $206,217 |
| 2015 | $21,887 | $252,237 | $59,385 | $192,852 |
| 2014 | $22,019 | $246,025 | $63,779 | $182,246 |
| 2012 | $21,816 | $246,518 | $63,907 | $182,611 |
Source: Public Records
Map
Nearby Homes
- 4739 Wellington Dr
- 4864 Pond View Ct
- 4722 Wellington Dr
- 4726 Westbury Dr
- 4610 Forest Way Cir Unit 4
- 6248 Pine Tree Dr
- 6245 Pine Tree Dr
- 4523 Red Oak Ln
- 5632 Oakwood Cir
- 6421 Collier Cir
- 4373 Oak Leaf Ln
- 24150 Gilmer Rd
- 6517 Saddle Ridge Ct
- 239 W Ct of Shorewood Unit 3A
- 5538 Prairiemoor Ln
- 19818 W Stone Pond Ln
- 306 Richard Ct Unit 3
- 5364 Hedgewood Ct
- 109 Thorne Grove Dr
- 5236 Southwell Ct
- 4809 Preserve Pkwy
- 4810 Preserve Pkwy
- 4706 Cantibury Ct
- 4707 Cantibury Ct
- 4811 Preserve Pkwy
- 4704 Cantibury Ct
- 4831 Darlene Ct
- 4812 Preserve Pkwy
- 4708 Royal Melbourne Dr
- 4829 Darlene Ct
- 4823 Preserve Pkwy
- 4814 Preserve Pkwy
- 4830 Darlene Ct
- 4827 Darlene Ct
- 4709 Royal Melbourne Dr
- 4828 Darlene Ct
- 4825 Darlene Ct
- 4816 Kathleen Ct
- 4813 Kathleen Ct
- 4826 Darlene Ct