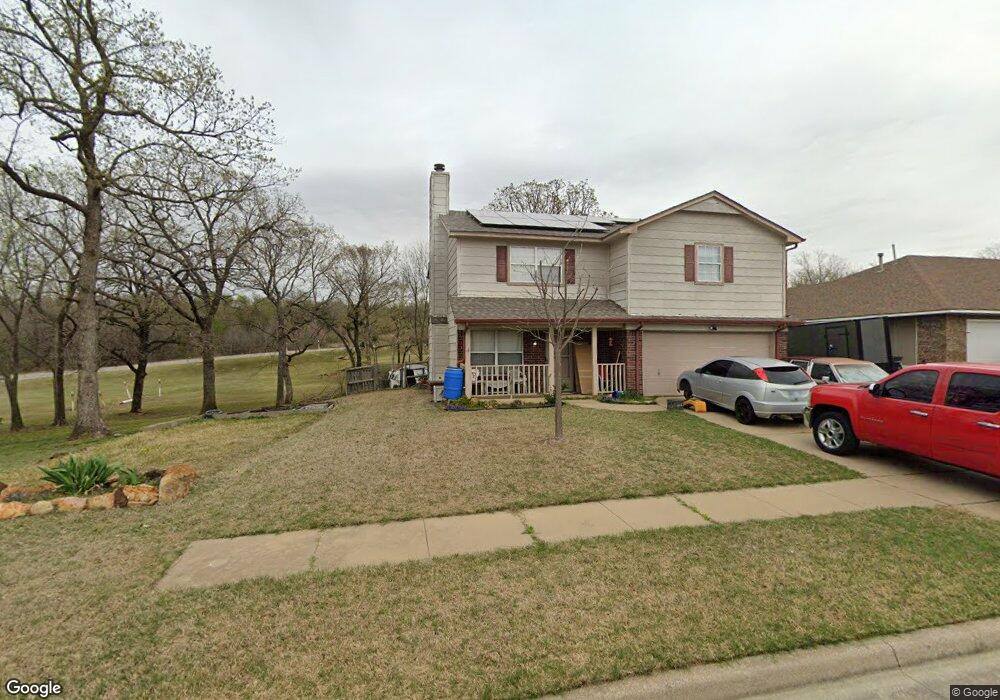
4809 Rustic Rd Sand Springs, OK 74063
Estimated Value: $233,630 - $304,000
3
Beds
3
Baths
1,724
Sq Ft
$152/Sq Ft
Est. Value
About This Home
This home is located at 4809 Rustic Rd, Sand Springs, OK 74063 and is currently estimated at $262,908, approximately $152 per square foot. 4809 Rustic Rd is a home located in Tulsa County with nearby schools including Limestone Technology Academy, Clyde Boyd Middle School, and Charles Page High School.
Ownership History
Date
Name
Owned For
Owner Type
Purchase Details
Closed on
Jul 10, 2013
Sold by
Ament Cynthia Jean and Ament Larry D
Bought by
Pitre Shawn
Current Estimated Value
Home Financials for this Owner
Home Financials are based on the most recent Mortgage that was taken out on this home.
Original Mortgage
$127,645
Outstanding Balance
$91,858
Interest Rate
3.83%
Mortgage Type
FHA
Estimated Equity
$171,050
Purchase Details
Closed on
Jul 13, 2006
Sold by
Ament Larry Dean
Bought by
Ament Cynthia Jean
Purchase Details
Closed on
Sep 27, 2000
Sold by
Blevins Herbert Neal and Blevins Lita
Bought by
Ament Larry D and Ament Cynthia J
Home Financials for this Owner
Home Financials are based on the most recent Mortgage that was taken out on this home.
Original Mortgage
$107,362
Interest Rate
7.99%
Mortgage Type
FHA
Purchase Details
Closed on
Aug 1, 1988
Purchase Details
Closed on
May 1, 1988
Create a Home Valuation Report for This Property
The Home Valuation Report is an in-depth analysis detailing your home's value as well as a comparison with similar homes in the area
Home Values in the Area
Average Home Value in this Area
Purchase History
| Date | Buyer | Sale Price | Title Company |
|---|---|---|---|
| Pitre Shawn | $130,000 | Apex Title & Closing Servic | |
| Ament Cynthia Jean | -- | None Available | |
| Ament Larry D | $110,500 | Tulsa Abstract & Title Co | |
| -- | $80,000 | -- | |
| -- | $11,000 | -- |
Source: Public Records
Mortgage History
| Date | Status | Borrower | Loan Amount |
|---|---|---|---|
| Open | Pitre Shawn | $127,645 | |
| Previous Owner | Ament Larry D | $107,362 |
Source: Public Records
Tax History Compared to Growth
Tax History
| Year | Tax Paid | Tax Assessment Tax Assessment Total Assessment is a certain percentage of the fair market value that is determined by local assessors to be the total taxable value of land and additions on the property. | Land | Improvement |
|---|---|---|---|---|
| 2025 | $2,241 | $17,547 | $1,657 | $15,890 |
| 2024 | $2,009 | $16,712 | $2,258 | $14,454 |
| 2023 | $2,009 | $15,916 | $2,151 | $13,765 |
| 2022 | $1,870 | $15,158 | $2,355 | $12,803 |
| 2021 | $1,883 | $15,015 | $2,333 | $12,682 |
| 2020 | $1,857 | $14,300 | $2,222 | $12,078 |
| 2019 | $1,805 | $14,300 | $2,222 | $12,078 |
| 2018 | $1,758 | $14,300 | $2,222 | $12,078 |
| 2017 | $1,723 | $14,300 | $2,222 | $12,078 |
| 2016 | $1,759 | $14,300 | $2,222 | $12,078 |
| 2015 | $1,784 | $14,300 | $2,222 | $12,078 |
| 2014 | $1,800 | $14,300 | $2,222 | $12,078 |
Source: Public Records
Map
Nearby Homes
- 4813 Rustic Rd
- 118 E 48th St
- 4602 S Linwood Dr
- 324 E 44th St
- 316 E 44th St
- 5110 S Everett St
- 5114 S Everett St
- 111 W 45th Place
- 5110 S Everett Dr
- 5114 S Everett Dr
- Ridgway III Plan at Stone Creek Estates IV
- Brenda MG Plan at Stone Creek Estates IV
- Walker ll Plan at Stone Creek Estates IV
- Dorsey Farm House Plan at Stone Creek Estates IV
- Oak Plan at Stone Creek Estates IV
- Ashville AE Plan at Stone Creek Estates IV
- Ashville Plan at Stone Creek Estates IV
- Lee II Plan at Stone Creek Estates IV
- Brenda Plan at Stone Creek Estates IV
- Hampton III Plan at Stone Creek Estates IV
- 4811 Rustic Rd
- 4808 Rustic Rd
- 4815 Rustic Rd
- 310 E 48th Place S
- 310 E 48th Place
- 308 E 48th Place
- 309 E 48th Place
- 4817 Rustic Rd
- 305 E 49th St
- 4802 Rustic Rd
- 309 E 49th St
- 4818 Rustic Rd
- 306 E 49th St
- 4806 S Mckinley Ave
- 4826 S Linwood Dr
- 4808 S Mckinley Ave
- 0 Rustic Rd
- 4814 Rustic Rd
- 4814 Rustic Rd
- 310 E 49th St