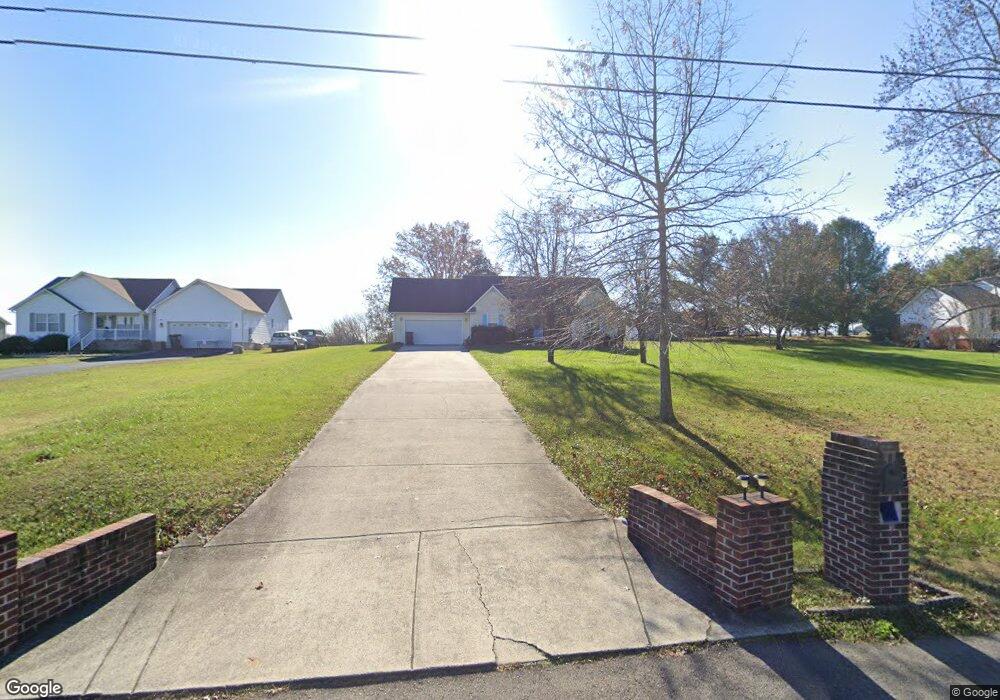
4809 Skyview Dr Cookeville, TN 38501
Estimated Value: $282,180 - $346,000
--
Bed
2
Baths
1,569
Sq Ft
$204/Sq Ft
Est. Value
About This Home
This home is located at 4809 Skyview Dr, Cookeville, TN 38501 and is currently estimated at $320,295, approximately $204 per square foot. 4809 Skyview Dr is a home located in Putnam County with nearby schools including Cane Creek Elementary School, Upperman Middle School, and Upperman High School.
Ownership History
Date
Name
Owned For
Owner Type
Purchase Details
Closed on
Aug 10, 2024
Sold by
Stewart Carrie Ann
Bought by
Stewart Carrie Ann and Argo John Joseph
Current Estimated Value
Home Financials for this Owner
Home Financials are based on the most recent Mortgage that was taken out on this home.
Original Mortgage
$221,306
Interest Rate
6.95%
Mortgage Type
FHA
Purchase Details
Closed on
Mar 29, 2019
Sold by
Bussell Larry D
Bought by
Stewart Carrie Ann
Home Financials for this Owner
Home Financials are based on the most recent Mortgage that was taken out on this home.
Original Mortgage
$90,000
Interest Rate
4.3%
Mortgage Type
Commercial
Purchase Details
Closed on
May 25, 2001
Bought by
Bussell Larry
Purchase Details
Closed on
Dec 14, 1999
Sold by
Cecil Whitson
Bought by
Dennis Chaffin
Purchase Details
Closed on
Nov 17, 1991
Bought by
Whitson Cecil I
Purchase Details
Closed on
Nov 20, 1981
Bought by
Whitson Cecil T
Purchase Details
Closed on
Oct 10, 1970
Create a Home Valuation Report for This Property
The Home Valuation Report is an in-depth analysis detailing your home's value as well as a comparison with similar homes in the area
Home Values in the Area
Average Home Value in this Area
Purchase History
| Date | Buyer | Sale Price | Title Company |
|---|---|---|---|
| Stewart Carrie Ann | -- | None Listed On Document | |
| Stewart Carrie Ann | -- | None Listed On Document | |
| Stewart Carrie Ann | -- | -- | |
| Bussell Larry | $100,700 | -- | |
| Dennis Chaffin | $8,500 | -- | |
| Whitson Cecil I | -- | -- | |
| Whitson Cecil T | -- | -- | |
| -- | -- | -- |
Source: Public Records
Mortgage History
| Date | Status | Borrower | Loan Amount |
|---|---|---|---|
| Previous Owner | Stewart Carrie Ann | $221,306 | |
| Previous Owner | Stewart Carrie Ann | $90,000 |
Source: Public Records
Tax History Compared to Growth
Tax History
| Year | Tax Paid | Tax Assessment Tax Assessment Total Assessment is a certain percentage of the fair market value that is determined by local assessors to be the total taxable value of land and additions on the property. | Land | Improvement |
|---|---|---|---|---|
| 2024 | $1,168 | $43,925 | $5,000 | $38,925 |
| 2023 | $1,168 | $43,925 | $5,000 | $38,925 |
| 2022 | $1,086 | $43,925 | $5,000 | $38,925 |
| 2021 | $1,086 | $43,925 | $5,000 | $38,925 |
| 2020 | $969 | $43,925 | $5,000 | $38,925 |
| 2019 | $969 | $33,125 | $5,000 | $28,125 |
| 2018 | $904 | $33,125 | $5,000 | $28,125 |
| 2017 | $904 | $33,125 | $5,000 | $28,125 |
| 2016 | $904 | $33,125 | $5,000 | $28,125 |
| 2015 | $929 | $33,125 | $5,000 | $28,125 |
| 2014 | $909 | $32,424 | $0 | $0 |
Source: Public Records
Map
Nearby Homes
- 1920 Clemmons Rd
- 1764 Bouton Dr
- 1711 Creekside Dr
- 1775 Creekside Dr
- 2312 Benjy Cir
- 3815 Spurgeon Dr
- 918 Faye Dr
- 2269 Plunk Whitson Rd
- 0 Bloomington Rd
- 3709 Poundstone Dr
- 4763 Cumby Rd
- 2618 Whispering Oak Ln
- 2450 Whispering Oaks Ln
- 2694 Whispering Oaks Ln
- 2600 Whispering Oaks Ln
- 2636 Whispering Oaks Ln
- 2870 Autumn Woods Trail
- 4131 Charlton Square
- 2895 Autumn Woods Trail
- 4746 Maple Shade Cir
- 4813 Skyview Dr
- 4805 Skyview Dr
- 4817 Skyview Dr
- 1805 Clemmons Rd
- 4804 Skyview Dr
- 4821 Skyview Dr
- 4825 Skyview Dr
- 1775 Clemmons Rd
- 1870 Clemmons Rd
- 1848 Clemmons Rd
- 4824 Skyview Dr
- 1804 Clemmons Rd
- 1782 Clemmons Rd
- 4829 Skyview Dr
- 1898 Clemmons Rd
- 1760 Clemmons Rd
- 1750 Clemmons Rd
- 4832 Skyview Dr
- 4837 Skyview Dr
- 1717 Hullon Dyer Dr