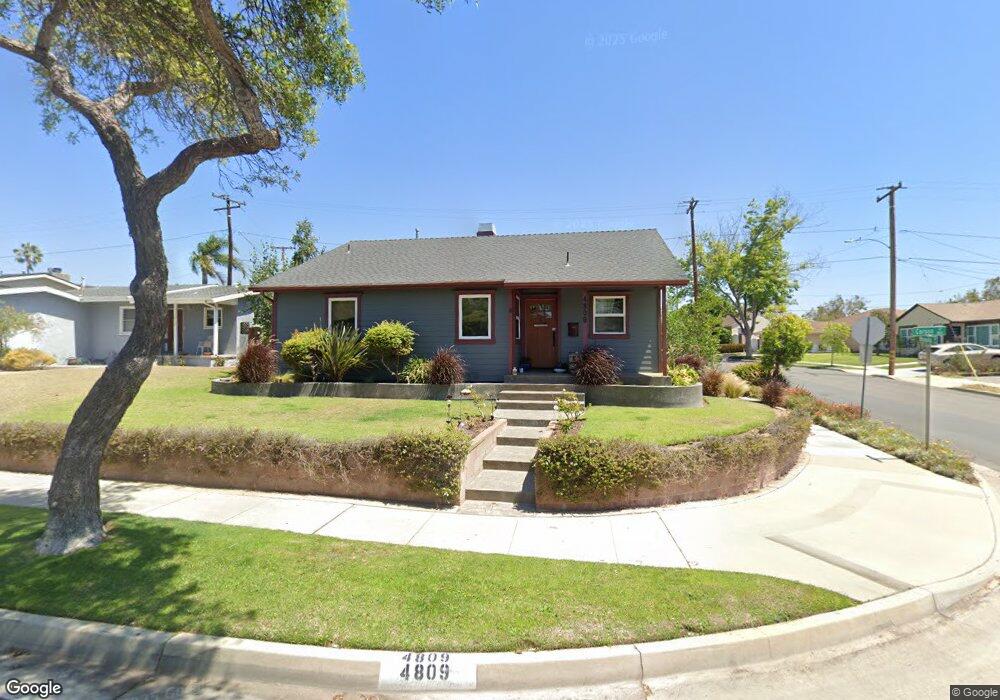
4809 W Carson St Torrance, CA 90503
Southwood NeighborhoodEstimated Value: $1,360,000 - $1,428,000
3
Beds
3
Baths
1,175
Sq Ft
$1,180/Sq Ft
Est. Value
About This Home
This home is located at 4809 W Carson St, Torrance, CA 90503 and is currently estimated at $1,386,950, approximately $1,180 per square foot. 4809 W Carson St is a home located in Los Angeles County with nearby schools including Anza Elementary School, Jefferson Middle School, and West High School.
Ownership History
Date
Name
Owned For
Owner Type
Purchase Details
Closed on
Mar 4, 2005
Sold by
Ellenor Angela M and Martinez Angela M
Bought by
Ellenor Dwayne T and Ellenor Angela M
Current Estimated Value
Home Financials for this Owner
Home Financials are based on the most recent Mortgage that was taken out on this home.
Original Mortgage
$500,000
Outstanding Balance
$174,826
Interest Rate
1%
Mortgage Type
New Conventional
Estimated Equity
$1,212,124
Purchase Details
Closed on
Feb 11, 2003
Sold by
Ellison Sean C and Alarcon Dana E
Bought by
Martinez Angela M
Home Financials for this Owner
Home Financials are based on the most recent Mortgage that was taken out on this home.
Original Mortgage
$354,000
Interest Rate
5.93%
Purchase Details
Closed on
Sep 25, 2001
Sold by
East Mary M
Bought by
East Mary M and Alarcon Dana E
Create a Home Valuation Report for This Property
The Home Valuation Report is an in-depth analysis detailing your home's value as well as a comparison with similar homes in the area
Home Values in the Area
Average Home Value in this Area
Purchase History
| Date | Buyer | Sale Price | Title Company |
|---|---|---|---|
| Ellenor Dwayne T | -- | Fidelity National Title Co | |
| Martinez Angela M | $442,500 | Fidelity | |
| East Mary M | -- | -- |
Source: Public Records
Mortgage History
| Date | Status | Borrower | Loan Amount |
|---|---|---|---|
| Open | Ellenor Dwayne T | $500,000 | |
| Closed | Martinez Angela M | $354,000 | |
| Closed | Ellenor Dwayne T | $70,000 |
Source: Public Records
Tax History
| Year | Tax Paid | Tax Assessment Tax Assessment Total Assessment is a certain percentage of the fair market value that is determined by local assessors to be the total taxable value of land and additions on the property. | Land | Improvement |
|---|---|---|---|---|
| 2025 | $7,975 | $701,873 | $512,700 | $189,173 |
| 2024 | $7,975 | $688,112 | $502,648 | $185,464 |
| 2023 | $7,827 | $674,621 | $492,793 | $181,828 |
| 2022 | $7,722 | $661,394 | $483,131 | $178,263 |
| 2021 | $7,580 | $648,426 | $473,658 | $174,768 |
| 2019 | $7,359 | $629,195 | $459,610 | $169,585 |
| 2018 | $7,129 | $616,859 | $450,599 | $166,260 |
| 2016 | $6,810 | $592,906 | $433,102 | $159,804 |
| 2015 | $6,661 | $584,001 | $426,597 | $157,404 |
| 2014 | $6,487 | $572,562 | $418,241 | $154,321 |
Source: Public Records
Map
Nearby Homes
- 5102 Lee St
- 4402 Cathann St
- 22305 Ladeene Ave
- 21345 Hawthorne Blvd Unit 217
- 1108 Camino Real Unit 407
- 1108 Camino Real Unit 409
- 21110 Wood Ave
- 22631 Kathryn Ave
- 21405 Mildred Ave
- 1110 Barbara St
- 1100 Barbara St
- 1200 Opal St Unit 7
- 641 S Prospect Ave Unit 103
- 22826 Marjorie Ave
- 904 Knob Hill Ave
- 5500 Torrance Blvd Unit B213
- 5538 Lorna St
- 1007 S Prospect Ave
- 1011 S Prospect Ave
- 20652 Vista Dr
- 4813 W Carson St
- 21717 Reynolds Dr
- 4817 W Carson St
- 4715 W Carson St
- 21713 Reynolds Dr
- 21724 Reynolds Dr
- 21714 Vicky Ave
- 21718 Vicky Ave
- 21720 Reynolds Dr
- 4709 W Carson St
- 4808 W Carson St
- 4812 W Carson St
- 21716 Reynolds Dr
- 4718 W Carson St
- 21709 Reynolds Dr
- 4816 W Carson St
- 21710 Vicky Ave
- 4705 W Carson St
- 4714 W Carson St
- 4820 W Carson St