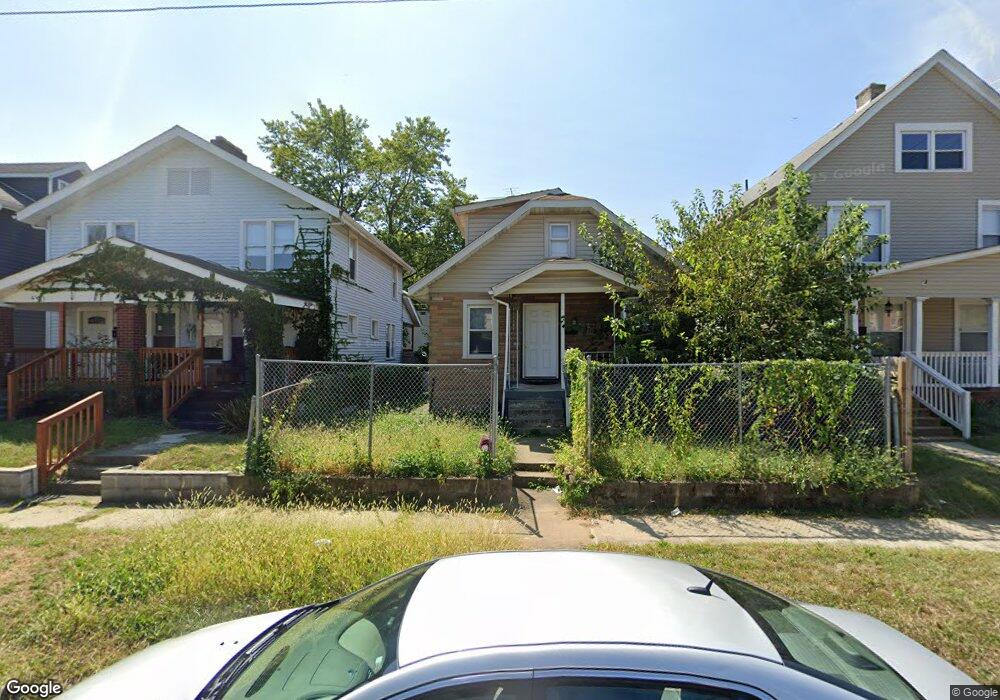
481 E Gates St Columbus, OH 43206
Karns Park NeighborhoodEstimated Value: $140,000 - $210,000
4
Beds
1
Bath
1,330
Sq Ft
$137/Sq Ft
Est. Value
About This Home
This home is located at 481 E Gates St, Columbus, OH 43206 and is currently estimated at $181,921, approximately $136 per square foot. 481 E Gates St is a home located in Franklin County with nearby schools including Lincoln Park Elementary School, South High School, and South Columbus Preparatory Academy.
Ownership History
Date
Name
Owned For
Owner Type
Purchase Details
Closed on
Jun 20, 2022
Sold by
Jackson Miko L
Bought by
Miller Niko C
Current Estimated Value
Purchase Details
Closed on
Feb 19, 2015
Sold by
Skiver Warren L
Bought by
Jackson Miko L
Purchase Details
Closed on
Aug 31, 2011
Sold by
Sarna Properties Llc
Bought by
Skiver Warren L
Purchase Details
Closed on
May 8, 2009
Sold by
Secretary Of Housing & Urban Development
Bought by
Sarna Properties Llc
Purchase Details
Closed on
Sep 29, 2008
Sold by
Wells Fargo Bank Na
Bought by
Hud
Purchase Details
Closed on
Sep 15, 2008
Sold by
Welch Elizabeth A and Case #07Cve12 17649
Bought by
Wells Fargo Bank Na
Purchase Details
Closed on
Nov 19, 1997
Sold by
Spradlin Madeline P and Spradlin Madeline D
Bought by
Welch Elizabeth A
Home Financials for this Owner
Home Financials are based on the most recent Mortgage that was taken out on this home.
Original Mortgage
$45,177
Interest Rate
7.38%
Mortgage Type
FHA
Create a Home Valuation Report for This Property
The Home Valuation Report is an in-depth analysis detailing your home's value as well as a comparison with similar homes in the area
Home Values in the Area
Average Home Value in this Area
Purchase History
| Date | Buyer | Sale Price | Title Company |
|---|---|---|---|
| Miller Niko C | -- | Bergman Robert D | |
| Jackson Miko L | $39,000 | None Available | |
| Skiver Warren L | $5,200 | Real Living | |
| Sarna Properties Llc | $8,195 | Lakeside | |
| Hud | -- | None Available | |
| Wells Fargo Bank Na | $48,000 | None Available | |
| Welch Elizabeth A | $45,000 | -- |
Source: Public Records
Mortgage History
| Date | Status | Borrower | Loan Amount |
|---|---|---|---|
| Previous Owner | Welch Elizabeth A | $45,177 |
Source: Public Records
Tax History
| Year | Tax Paid | Tax Assessment Tax Assessment Total Assessment is a certain percentage of the fair market value that is determined by local assessors to be the total taxable value of land and additions on the property. | Land | Improvement |
|---|---|---|---|---|
| 2025 | $4,323 | $63,250 | $20,930 | $42,320 |
| 2024 | $4,323 | $63,250 | $20,930 | $42,320 |
| 2023 | $2,802 | $63,245 | $20,930 | $42,315 |
| 2022 | $1,070 | $20,130 | $4,660 | $15,470 |
| 2021 | $1,072 | $20,130 | $4,660 | $15,470 |
| 2020 | $1,047 | $20,130 | $4,660 | $15,470 |
| 2019 | $988 | $16,280 | $3,890 | $12,390 |
| 2018 | $1,162 | $16,280 | $3,890 | $12,390 |
| 2017 | $1,034 | $16,280 | $3,890 | $12,390 |
| 2016 | $1,007 | $13,660 | $3,400 | $10,260 |
| 2015 | $1,164 | $13,660 | $3,400 | $10,260 |
| 2014 | $847 | $13,660 | $3,400 | $10,260 |
| 2013 | $439 | $14,350 | $3,570 | $10,780 |
Source: Public Records
Map
Nearby Homes
- 1274 Wager St
- 515 E Mithoff St
- 557 E Gates St
- 407 Hanford St Unit 409
- 564 Frebis Ave
- 575 Hanford St
- 524 Thurman Ave
- 532 E Moler St
- 519-521 E Deshler Ave
- 531 E Deshler Ave
- 1161 S Washington Ave
- 601 Frebis Ave
- 605 Frebis Ave
- 650 E Mithoff St
- 655 E Mithoff St
- 332 E Mithoff St
- 512 Cline St
- 516 Cline St
- 514 Cline St
- 1106-1116 Parsons Ave
- 485 E Gates St Unit 487
- 477 E Gates St Unit 479
- 477 E Gates St
- 479 E Gates St
- 477 E Gates St Unit 477-479
- 477 E Gates St Unit 2
- 491 E Gates St
- 471 E Gates St
- 469 E Gates St
- 467 E Gates St
- 499 E Gates St
- 476 Hanford St
- 472 Hanford St
- 465 E Gates St
- 478 E Gates St Unit 480
- 478 E Gates St Unit 478-480
- 478 E Gates St Unit 80
- 463 E Gates St
- 484 Hanford St
- 1312 Parsons Ave
Your Personal Tour Guide
Ask me questions while you tour the home.