Estimated Value: $277,000 - $553,000
9
Beds
4
Baths
3,620
Sq Ft
$117/Sq Ft
Est. Value
About This Home
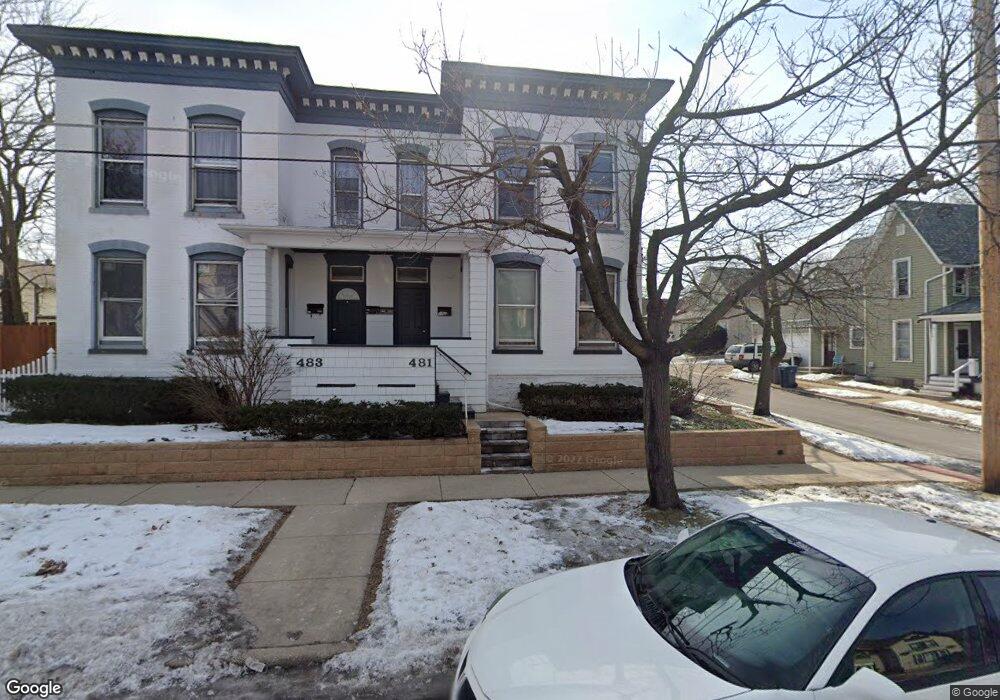
This home is located at 481 Laurel St Unit 83, Elgin, IL 60120 and is currently estimated at $422,042, approximately $116 per square foot. 481 Laurel St Unit 83 is a home located in Kane County with nearby schools including Channing Memorial Elementary School, Ellis Middle School, and Elgin High School.
Ownership History
Date
Name
Owned For
Owner Type
Purchase Details
Closed on
Sep 29, 1999
Sold by
United Companies Lending Corp
Bought by
Sanchez Zacarias and Sanchez Barbara
Current Estimated Value
Home Financials for this Owner
Home Financials are based on the most recent Mortgage that was taken out on this home.
Original Mortgage
$110,800
Interest Rate
7.78%
Mortgage Type
Purchase Money Mortgage
Purchase Details
Closed on
May 21, 1999
Sold by
Amarit Trirut
Bought by
United Companies Lending Corp
Purchase Details
Closed on
Mar 22, 1995
Sold by
Christiansen Eric O and Christiansen Mary A
Bought by
Amarit Trirut
Home Financials for this Owner
Home Financials are based on the most recent Mortgage that was taken out on this home.
Original Mortgage
$148,500
Interest Rate
8.91%
Mortgage Type
Purchase Money Mortgage
Create a Home Valuation Report for This Property
The Home Valuation Report is an in-depth analysis detailing your home's value as well as a comparison with similar homes in the area
Home Values in the Area
Average Home Value in this Area
Purchase History
| Date | Buyer | Sale Price | Title Company |
|---|---|---|---|
| Sanchez Zacarias | $138,500 | Burnet Title | |
| United Companies Lending Corp | -- | -- | |
| Amarit Trirut | $146,000 | -- |
Source: Public Records
Mortgage History
| Date | Status | Borrower | Loan Amount |
|---|---|---|---|
| Closed | Sanchez Zacarias | $110,800 | |
| Previous Owner | Amarit Trirut | $148,500 | |
| Closed | Sanchez Zacarias | $110,800 |
Source: Public Records
Tax History Compared to Growth
Tax History
| Year | Tax Paid | Tax Assessment Tax Assessment Total Assessment is a certain percentage of the fair market value that is determined by local assessors to be the total taxable value of land and additions on the property. | Land | Improvement |
|---|---|---|---|---|
| 2024 | $8,617 | $107,675 | $16,049 | $91,626 |
| 2023 | $8,292 | $97,276 | $14,499 | $82,777 |
| 2022 | $7,096 | $81,837 | $13,221 | $68,616 |
| 2021 | $6,826 | $76,512 | $12,361 | $64,151 |
| 2020 | $6,662 | $73,042 | $11,800 | $61,242 |
| 2019 | $6,498 | $69,577 | $11,240 | $58,337 |
| 2018 | $6,480 | $65,546 | $10,589 | $54,957 |
| 2017 | $6,373 | $61,964 | $10,010 | $51,954 |
| 2016 | $6,131 | $57,486 | $9,287 | $48,199 |
| 2015 | -- | $52,691 | $8,512 | $44,179 |
| 2014 | -- | $52,041 | $8,407 | $43,634 |
| 2013 | -- | $53,414 | $8,629 | $44,785 |
Source: Public Records
Map
Nearby Homes
- 270 Villa St
- 277 Gifford Place
- 306 S Liberty St
- 262 Bartlett Place
- 528 E Chicago St
- 552 E Chicago St
- 364 Bent St
- 518 Raymond St
- 144 Hill Ave
- 117 Tennyson Ct
- 603 Wellington Ave
- 370 North St
- 453 Addison St
- 72 Harding St
- 628 S Liberty St
- 653 Park St
- 309 Griswold St
- 456 Addison St
- 764 Terrace Ct Unit A
- 422 Ryerson Ave