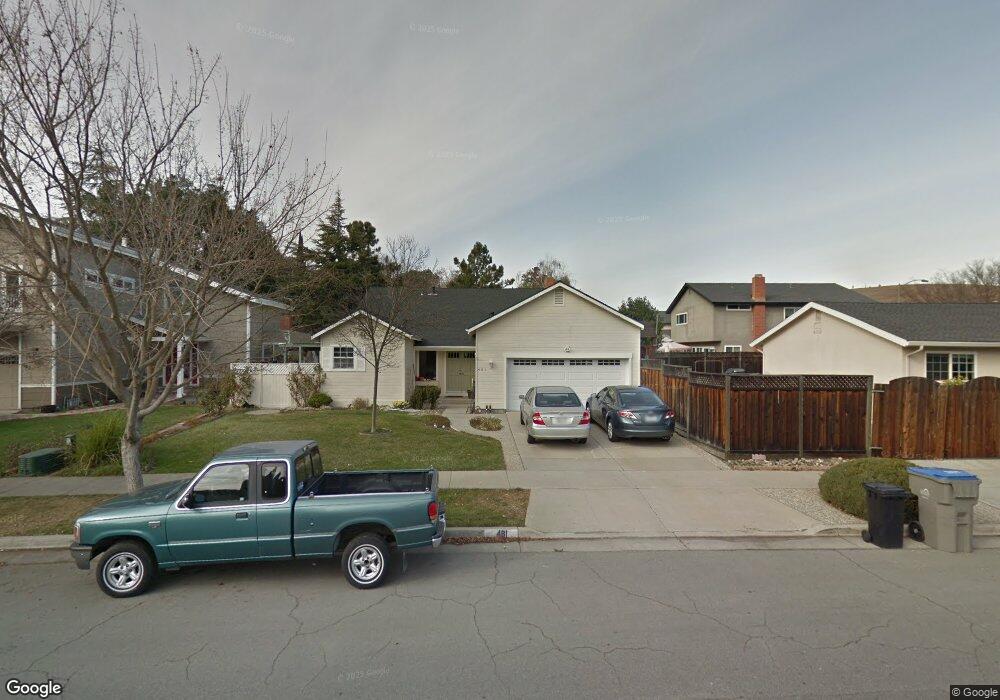
481 Los Pinos Way San Jose, CA 95123
Santa Teresa Foothills NeighborhoodEstimated Value: $1,355,000 - $1,660,000
4
Beds
2
Baths
1,597
Sq Ft
$940/Sq Ft
Est. Value
About This Home
This home is located at 481 Los Pinos Way, San Jose, CA 95123 and is currently estimated at $1,500,971, approximately $939 per square foot. 481 Los Pinos Way is a home located in Santa Clara County with nearby schools including Bertha Taylor Elementary School, Bernal Intermediate School, and Santa Teresa High School.
Ownership History
Date
Name
Owned For
Owner Type
Purchase Details
Closed on
Apr 13, 2018
Sold by
Miller Marc Frederic and Miller Julie Ann
Bought by
Miller Marc Frederic and Miller Julie Ann
Current Estimated Value
Home Financials for this Owner
Home Financials are based on the most recent Mortgage that was taken out on this home.
Original Mortgage
$250,000
Interest Rate
4.46%
Mortgage Type
Credit Line Revolving
Purchase Details
Closed on
Jun 14, 2017
Sold by
Miller Marc Frederic and Miller Julie Ann
Bought by
Miller Marc Frederic and Miller Julie Ann
Home Financials for this Owner
Home Financials are based on the most recent Mortgage that was taken out on this home.
Original Mortgage
$65,000
Interest Rate
4.02%
Mortgage Type
New Conventional
Purchase Details
Closed on
Jan 11, 2010
Sold by
Miller Marc F and Miller Julie
Bought by
Miller Marc Frederic and Miller Julie Ann
Create a Home Valuation Report for This Property
The Home Valuation Report is an in-depth analysis detailing your home's value as well as a comparison with similar homes in the area
Home Values in the Area
Average Home Value in this Area
Purchase History
| Date | Buyer | Sale Price | Title Company |
|---|---|---|---|
| Miller Marc Frederic | -- | Chicago Title | |
| Miller Marc Frederic | -- | Chicago Title Co | |
| Miller Marc Frederic | -- | None Available | |
| Miller Marc Frederic | -- | Fidelity National Title | |
| Miller Marc Frederic | -- | None Available |
Source: Public Records
Mortgage History
| Date | Status | Borrower | Loan Amount |
|---|---|---|---|
| Closed | Miller Marc Frederic | $250,000 | |
| Closed | Miller Marc Frederic | $65,000 |
Source: Public Records
Tax History Compared to Growth
Tax History
| Year | Tax Paid | Tax Assessment Tax Assessment Total Assessment is a certain percentage of the fair market value that is determined by local assessors to be the total taxable value of land and additions on the property. | Land | Improvement |
|---|---|---|---|---|
| 2025 | $5,580 | $336,486 | $89,558 | $246,928 |
| 2024 | $5,580 | $329,889 | $87,802 | $242,087 |
| 2023 | $5,462 | $323,422 | $86,081 | $237,341 |
| 2022 | $5,425 | $317,082 | $84,394 | $232,688 |
| 2021 | $5,301 | $310,866 | $82,740 | $228,126 |
| 2020 | $5,153 | $307,679 | $81,892 | $225,787 |
| 2019 | $5,017 | $301,647 | $80,287 | $221,360 |
| 2018 | $4,964 | $295,733 | $78,713 | $217,020 |
| 2017 | $4,890 | $289,935 | $77,170 | $212,765 |
| 2016 | $4,654 | $284,251 | $75,657 | $208,594 |
| 2015 | $4,547 | $279,982 | $74,521 | $205,461 |
| 2014 | $3,989 | $274,499 | $73,062 | $201,437 |
Source: Public Records
Map
Nearby Homes
- 6273 Mountford Dr
- 6449 Curie Ct
- 497 Curie Dr
- 406 Madison Dr
- 471 Tovar Dr
- 6239 Mahan Dr
- 6129 Glen Harbor Dr
- 364 Utica Ln
- 6441 Cottle Rd
- 401 Henderson Dr
- 529 Galen Dr
- 343 Nature Dr
- 415 Conestoga Way
- 579 Suisse Dr
- 5991 Sorrel Ave
- 6298 Snell Ave
- 6362 San Anselmo Way
- 6375 San Anselmo Way
- 299 Moraga Way
- 379 Roan St
- 483 Los Pinos Way
- 6293 Valroy Dr
- 6297 Valroy Dr
- 6289 Valroy Dr
- 487 Los Pinos Way
- 6285 Valroy Dr
- 478 Valroy Ct
- 474 Valroy Ct
- 491 Los Pinos Way
- 6303 Benzo Dr
- 482 Valroy Ct
- 478 Los Pinos Way
- 6281 Valroy Dr
- 495 Los Pinos Way
- 486 Valroy Ct
- 6307 Benzo Dr
- 476 Los Pinos Way
- 494 Los Pinos Way
- 6296 Valroy Dr
- 6292 Valroy Dr