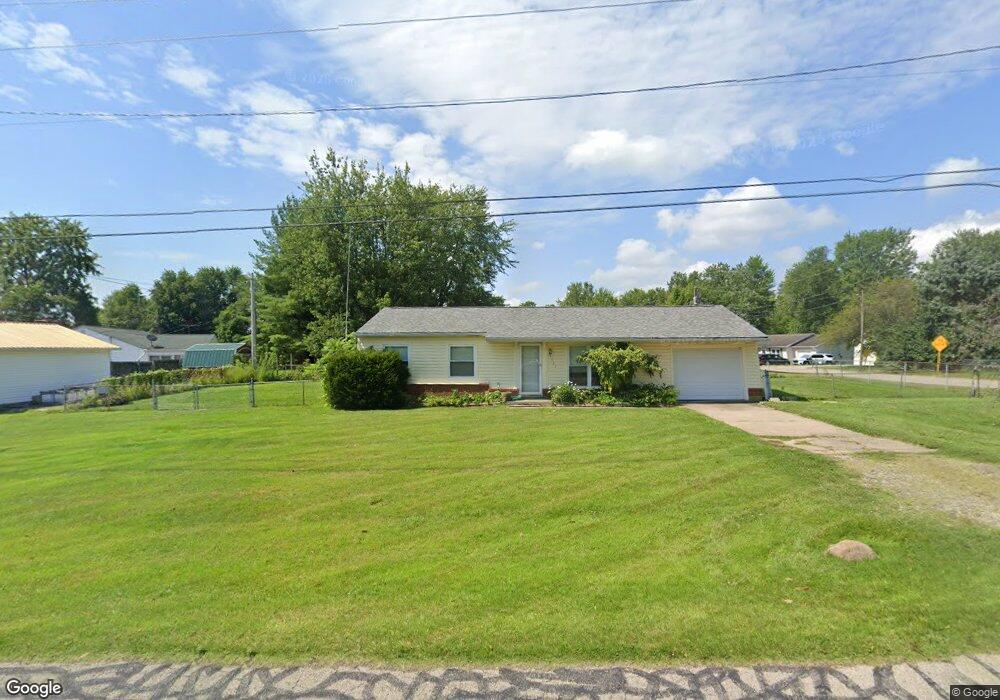
481 N Columbus St Blanchester, OH 45107
Estimated Value: $174,084 - $217,000
3
Beds
1
Bath
1,008
Sq Ft
$198/Sq Ft
Est. Value
About This Home
This home is located at 481 N Columbus St, Blanchester, OH 45107 and is currently estimated at $199,271, approximately $197 per square foot. 481 N Columbus St is a home located in Clinton County with nearby schools including Putman Elementary School, Blanchester Middle School, and Blanchester High School.
Ownership History
Date
Name
Owned For
Owner Type
Purchase Details
Closed on
Sep 28, 2005
Sold by
Thompson Ina M
Bought by
Mcelwee Robert
Current Estimated Value
Home Financials for this Owner
Home Financials are based on the most recent Mortgage that was taken out on this home.
Original Mortgage
$76,000
Outstanding Balance
$39,600
Interest Rate
5.93%
Mortgage Type
Fannie Mae Freddie Mac
Estimated Equity
$159,671
Purchase Details
Closed on
Sep 22, 2005
Sold by
Thompson Ina M
Bought by
Mcelwee Robert
Home Financials for this Owner
Home Financials are based on the most recent Mortgage that was taken out on this home.
Original Mortgage
$76,000
Outstanding Balance
$39,600
Interest Rate
5.93%
Mortgage Type
Fannie Mae Freddie Mac
Estimated Equity
$159,671
Purchase Details
Closed on
Jun 9, 2000
Sold by
Davis David A
Bought by
Thompson Ina M
Home Financials for this Owner
Home Financials are based on the most recent Mortgage that was taken out on this home.
Original Mortgage
$71,932
Interest Rate
8.14%
Mortgage Type
FHA
Purchase Details
Closed on
Jan 1, 1990
Bought by
Davis David A
Create a Home Valuation Report for This Property
The Home Valuation Report is an in-depth analysis detailing your home's value as well as a comparison with similar homes in the area
Home Values in the Area
Average Home Value in this Area
Purchase History
| Date | Buyer | Sale Price | Title Company |
|---|---|---|---|
| Mcelwee Robert | $95,000 | -- | |
| Mcelwee Robert | $95,000 | None Available | |
| Thompson Ina M | $72,000 | -- | |
| Davis David A | -- | -- |
Source: Public Records
Mortgage History
| Date | Status | Borrower | Loan Amount |
|---|---|---|---|
| Open | Mcelwee Robert | $76,000 | |
| Previous Owner | Thompson Ina M | $71,932 |
Source: Public Records
Tax History
| Year | Tax Paid | Tax Assessment Tax Assessment Total Assessment is a certain percentage of the fair market value that is determined by local assessors to be the total taxable value of land and additions on the property. | Land | Improvement |
|---|---|---|---|---|
| 2025 | $1,298 | $46,980 | $7,530 | $39,450 |
| 2024 | $1,298 | $46,980 | $7,530 | $39,450 |
| 2023 | $1,391 | $46,980 | $7,530 | $39,450 |
| 2022 | $936 | $31,400 | $5,190 | $26,210 |
| 2021 | $981 | $31,400 | $5,190 | $26,210 |
| 2020 | $978 | $31,400 | $5,190 | $26,210 |
| 2019 | $734 | $25,240 | $5,180 | $20,060 |
| 2018 | $738 | $25,240 | $5,180 | $20,060 |
| 2017 | $446 | $29,120 | $5,180 | $23,940 |
| 2016 | $617 | $23,520 | $5,250 | $18,270 |
| 2015 | $617 | $23,520 | $5,250 | $18,270 |
| 2013 | $598 | $22,650 | $5,250 | $17,400 |
Source: Public Records
Map
Nearby Homes
- 501 E Johns St
- 157 Pansy Pike
- 9 Pansy Pike
- 11 Pansy Pike
- 12 Pansy Pike
- 10 Pansy Pike
- 117 Pansy Pike
- 1 Middleboro Rd
- 305 E Main St
- 203 E Main St
- 112 W Baldwin St
- 816 E Center St
- 502 Railroad St
- 308 S Broadway St
- 125 W Fancy St
- 143 W Fancy St
- 503 S Broadway St
- 308 Lazenby St
- 501 S Wright St
- 0 Ohio 123 Unit 11 938995
- 150 Lee Ann Ct
- 477 N Columbus St
- 505 N Columbus St
- 102 Lee Ann Ct
- 146 Lee Ann Ct
- 116 Willow Place
- 513 N Columbus St
- 104 Lee Ann Ct
- 144 Lee Ann Ct
- 453 N Columbus St
- 124 Willow Place
- 106 Lee Ann Ct
- 521 N Columbus St
- 144 Willow Place
- 108 Lee Ann Ct
- 142 Lee Ann Ct
- 126 Willow Place
- 110 Lee Ann Ct
- 529 N Columbus St
- 447 N Columbus St
Your Personal Tour Guide
Ask me questions while you tour the home.