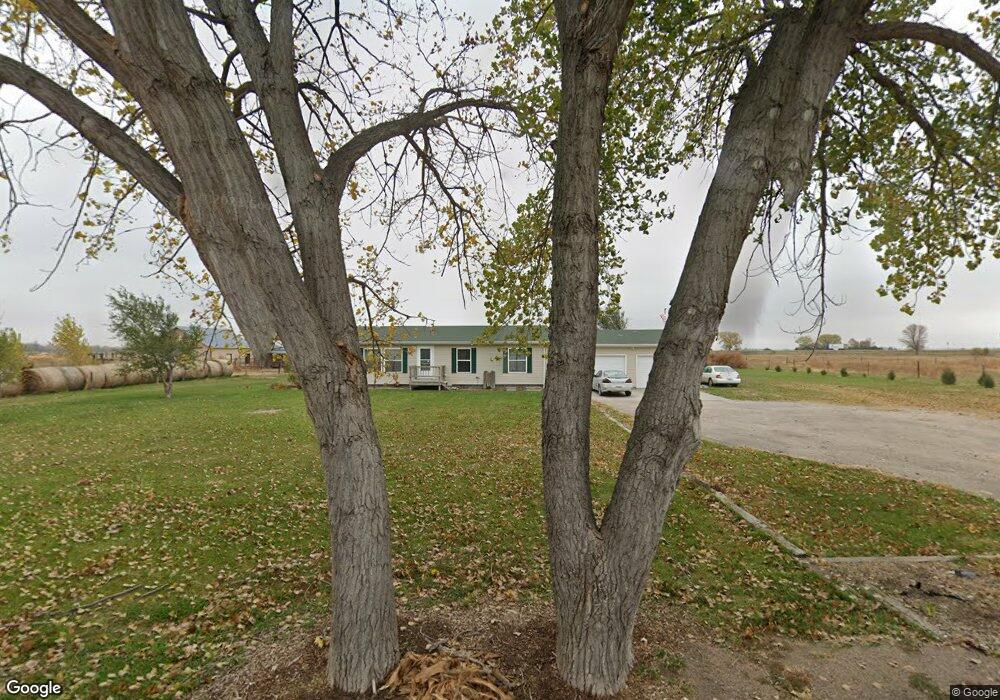
481 N James Dr Hershey, NE 69143
Estimated Value: $257,000 - $332,021
3
Beds
2
Baths
1,560
Sq Ft
$192/Sq Ft
Est. Value
About This Home
This home is located at 481 N James Dr, Hershey, NE 69143 and is currently estimated at $300,005, approximately $192 per square foot. 481 N James Dr is a home located in Lincoln County with nearby schools including Hershey High School.
Ownership History
Date
Name
Owned For
Owner Type
Purchase Details
Closed on
Jun 25, 2018
Sold by
Mccain Kylie J and Mccain Stefanie J
Bought by
Russman Riley J and Russman Pamela M
Current Estimated Value
Home Financials for this Owner
Home Financials are based on the most recent Mortgage that was taken out on this home.
Original Mortgage
$165,938
Outstanding Balance
$142,902
Interest Rate
4.5%
Mortgage Type
FHA
Estimated Equity
$157,103
Purchase Details
Closed on
Oct 27, 2009
Sold by
Cizek Andrew J and Cizek Davina D
Bought by
Mccain Kylie J and Mccain Stefanie J
Home Financials for this Owner
Home Financials are based on the most recent Mortgage that was taken out on this home.
Original Mortgage
$148,265
Interest Rate
5.06%
Mortgage Type
FHA
Purchase Details
Closed on
Nov 28, 2006
Sold by
Patras Shawn and Patras Amy L
Bought by
Cizek Andrew J and Cizek Davin P
Home Financials for this Owner
Home Financials are based on the most recent Mortgage that was taken out on this home.
Original Mortgage
$116,800
Interest Rate
6.41%
Mortgage Type
New Conventional
Create a Home Valuation Report for This Property
The Home Valuation Report is an in-depth analysis detailing your home's value as well as a comparison with similar homes in the area
Home Values in the Area
Average Home Value in this Area
Purchase History
| Date | Buyer | Sale Price | Title Company |
|---|---|---|---|
| Russman Riley J | $169,000 | Title Services Of The Plains | |
| Mccain Kylie J | $151,000 | None Available | |
| Cizek Andrew J | $146,000 | None Available |
Source: Public Records
Mortgage History
| Date | Status | Borrower | Loan Amount |
|---|---|---|---|
| Open | Russman Riley J | $165,938 | |
| Previous Owner | Mccain Kylie J | $148,265 | |
| Previous Owner | Cizek Andrew J | $116,800 |
Source: Public Records
Tax History Compared to Growth
Tax History
| Year | Tax Paid | Tax Assessment Tax Assessment Total Assessment is a certain percentage of the fair market value that is determined by local assessors to be the total taxable value of land and additions on the property. | Land | Improvement |
|---|---|---|---|---|
| 2025 | $2,498 | $237,547 | $66,500 | $171,047 |
| 2024 | $2,498 | $225,002 | $66,500 | $158,502 |
| 2023 | $2,870 | $194,904 | $52,000 | $142,904 |
| 2022 | $2,817 | $172,795 | $52,000 | $120,795 |
| 2021 | $2,401 | $172,795 | $52,000 | $120,795 |
| 2020 | $2,346 | $172,795 | $52,000 | $120,795 |
| 2019 | $2,219 | $170,575 | $21,000 | $149,575 |
| 2018 | $2,132 | $170,575 | $21,000 | $149,575 |
| 2017 | $2,077 | $166,210 | $21,000 | $145,210 |
| 2016 | $1,976 | $156,600 | $21,000 | $135,600 |
| 2014 | $2,062 | $134,180 | $21,000 | $113,180 |
Source: Public Records
Map
Nearby Homes
- 2991 S Pkwy Unit Hershey NE 69143
- 2991 S Parkway Rd
- 407 W 2nd St
- 205 W Grove St
- 608 N Patterson Ct
- 608 N Gilman Ct
- 0000 N Park Ct
- 233 W Bronco Rd
- Lot 1 SW Ridgecrest Cir
- 14410 W Wildlife Rd
- 4975 W A St
- 4173 Sweetwood Dr
- 4143 Sweetwood Dr
- 321 Elm St
- 0 Linden Lots
- 8515 W Foothill Rd
- 851 Cobbler Ln
- 440 Linden St
- 431 Linden St
- 3913 W A St
- 498 N James Dr
- 597 N James Dr
- 638 N James Dr
- 762 N James Dr
- 749 N James Dr
- 17313 W Oregon Trail Rd
- 723 N Wild Rose Rd
- 547 N Wild Rose Rd
- 16527 W Oregon Trail Rd
- 681 N Wild Rose Rd
- 642 N Wild Rose Rd
- 866 N Wild Rose Rd
- 714 N Wild Rose Rd
- 16123 W Oregon Trail Rd
- 1365 N Wild Rose Rd
- 1364 N Wild Rose Rd
- 17884 W Slough Rd
- 0 Hershey South Platte River Wildlife Unit 11285583
- 18248 W Slough Rd
- 1116 S Wild Rose Rd