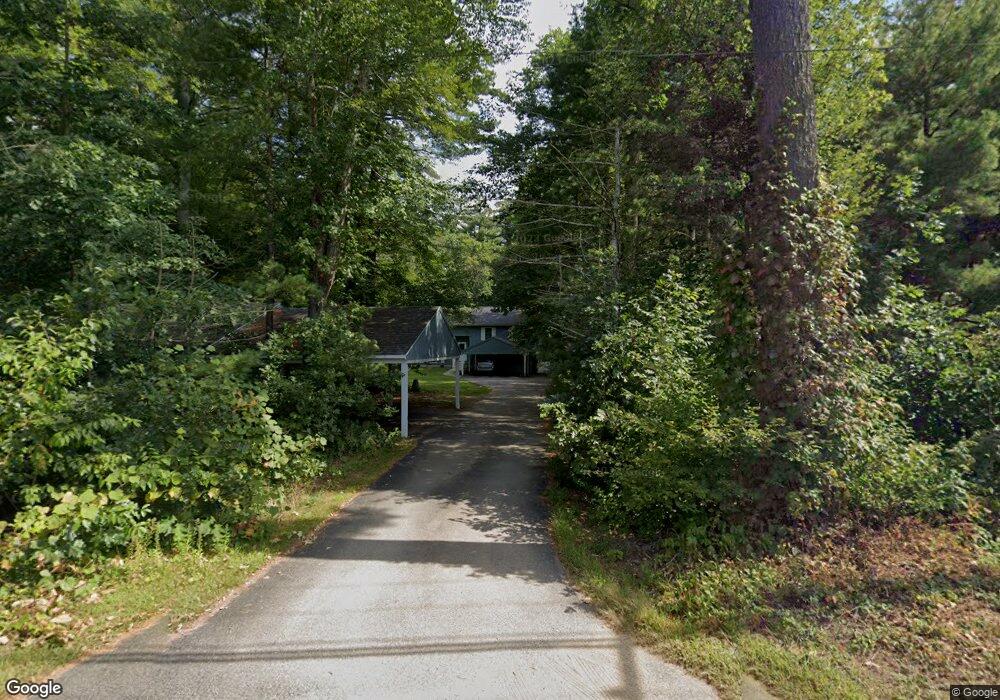
481 Podunk Rd East Brookfield, MA 01515
Estimated Value: $384,000 - $463,000
3
Beds
4
Baths
1,582
Sq Ft
$270/Sq Ft
Est. Value
About This Home
This home is located at 481 Podunk Rd, East Brookfield, MA 01515 and is currently estimated at $426,657, approximately $269 per square foot. 481 Podunk Rd is a home located in Worcester County with nearby schools including David Prouty High School.
Ownership History
Date
Name
Owned For
Owner Type
Purchase Details
Closed on
Aug 22, 2023
Sold by
Brunelle Timothy H and Brunelle Kathryn L
Bought by
Brunelle Timothy H
Current Estimated Value
Create a Home Valuation Report for This Property
The Home Valuation Report is an in-depth analysis detailing your home's value as well as a comparison with similar homes in the area
Home Values in the Area
Average Home Value in this Area
Purchase History
| Date | Buyer | Sale Price | Title Company |
|---|---|---|---|
| Brunelle Timothy H | -- | None Available | |
| Brunelle Timothy H | -- | None Available |
Source: Public Records
Tax History Compared to Growth
Tax History
| Year | Tax Paid | Tax Assessment Tax Assessment Total Assessment is a certain percentage of the fair market value that is determined by local assessors to be the total taxable value of land and additions on the property. | Land | Improvement |
|---|---|---|---|---|
| 2025 | $4,913 | $382,600 | $74,000 | $308,600 |
| 2024 | $4,628 | $362,400 | $67,500 | $294,900 |
| 2023 | $4,241 | $323,500 | $61,400 | $262,100 |
| 2022 | $4,473 | $330,600 | $52,600 | $278,000 |
| 2021 | $4,327 | $291,800 | $52,600 | $239,200 |
| 2020 | $4,136 | $279,100 | $52,600 | $226,500 |
| 2019 | $4,264 | $258,900 | $52,600 | $206,300 |
| 2018 | $4,117 | $266,300 | $52,700 | $213,600 |
| 2017 | $4,013 | $246,500 | $48,700 | $197,800 |
| 2016 | $4,030 | $230,800 | $48,700 | $182,100 |
| 2015 | $4,007 | $230,800 | $48,700 | $182,100 |
| 2014 | $4,021 | $230,800 | $48,700 | $182,100 |
Source: Public Records
Map
Nearby Homes