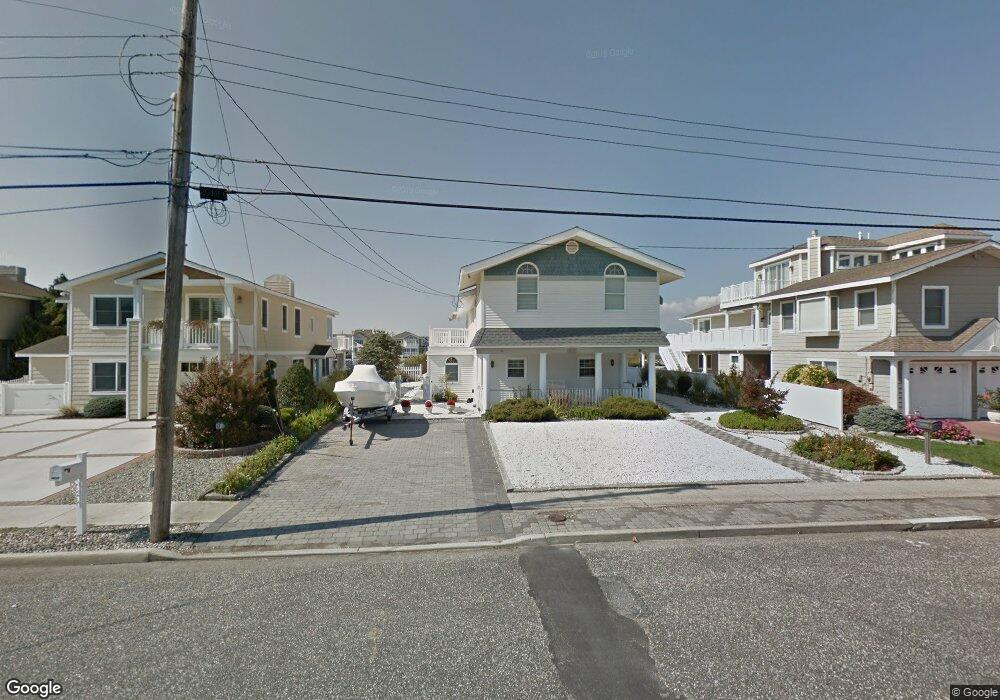
4810 4th Ave Avalon, NJ 08202
Estimated Value: $3,596,000 - $4,865,000
Studio
--
Bath
2,112
Sq Ft
$1,929/Sq Ft
Est. Value
About This Home
This home is located at 4810 4th Ave, Avalon, NJ 08202 and is currently estimated at $4,074,777, approximately $1,929 per square foot. 4810 4th Ave is a home located in Cape May County with nearby schools including Avalon Elementary School.
Ownership History
Date
Name
Owned For
Owner Type
Purchase Details
Closed on
Dec 11, 2014
Sold by
Schlitt Ludwig E and Schlitt Noreen
Bought by
Schlitt Ludwig E and Schlitt Noreen
Current Estimated Value
Purchase Details
Closed on
Jan 23, 2006
Sold by
Schlitt Ludwig E and Schlitt Noreen
Bought by
Schlitt Ludwig E and Schlitt Noreen
Purchase Details
Closed on
Feb 21, 2005
Sold by
Schlitt Ludwig E and Schlitt Noreen
Bought by
Schlitt Ludwig E and Schlitt Noreen
Purchase Details
Closed on
Aug 18, 2004
Sold by
Schlitt Noreen
Bought by
Schlitt Ludwig E and Schlitt Noreen
Purchase Details
Closed on
Aug 3, 1993
Sold by
Schlitt Ludwig E and Schlitt Noreen
Bought by
Schlitt Noreen
Purchase Details
Closed on
Feb 6, 1991
Sold by
New Jersey Dep
Bought by
Schlitt Ludwig E and Schlitt Noreen
Create a Home Valuation Report for This Property
The Home Valuation Report is an in-depth analysis detailing your home's value as well as a comparison with similar homes in the area
Home Values in the Area
Average Home Value in this Area
Purchase History
| Date | Buyer | Sale Price | Title Company |
|---|---|---|---|
| Schlitt Ludwig E | $160,000 | None Available | |
| Schlitt Ludwig E | $80,000 | None Available | |
| Schlitt Ludwig E | $80,000 | -- | |
| Schlitt Ludwig E | -- | -- | |
| Schlitt Noreen | -- | -- | |
| Schlitt Ludwig E | $500 | -- |
Source: Public Records
Tax History
| Year | Tax Paid | Tax Assessment Tax Assessment Total Assessment is a certain percentage of the fair market value that is determined by local assessors to be the total taxable value of land and additions on the property. | Land | Improvement |
|---|---|---|---|---|
| 2025 | $11,501 | $1,873,100 | $1,700,000 | $173,100 |
| 2024 | $11,501 | $1,873,100 | $1,700,000 | $173,100 |
| 2023 | $11,427 | $1,876,300 | $1,700,000 | $176,300 |
| 2022 | $10,657 | $1,876,300 | $1,700,000 | $176,300 |
| 2021 | $10,263 | $1,876,300 | $1,700,000 | $176,300 |
| 2020 | $9,869 | $1,876,300 | $1,700,000 | $176,300 |
| 2019 | $9,569 | $1,876,300 | $1,700,000 | $176,300 |
| 2018 | $9,156 | $1,876,300 | $1,700,000 | $176,300 |
| 2017 | $10,113 | $1,818,800 | $1,600,000 | $218,800 |
| 2016 | $10,003 | $1,818,800 | $1,600,000 | $218,800 |
| 2015 | $9,840 | $1,818,800 | $1,600,000 | $218,800 |
| 2014 | $9,731 | $1,818,800 | $1,600,000 | $218,800 |
Source: Public Records
Map
Nearby Homes
Your Personal Tour Guide
Ask me questions while you tour the home.