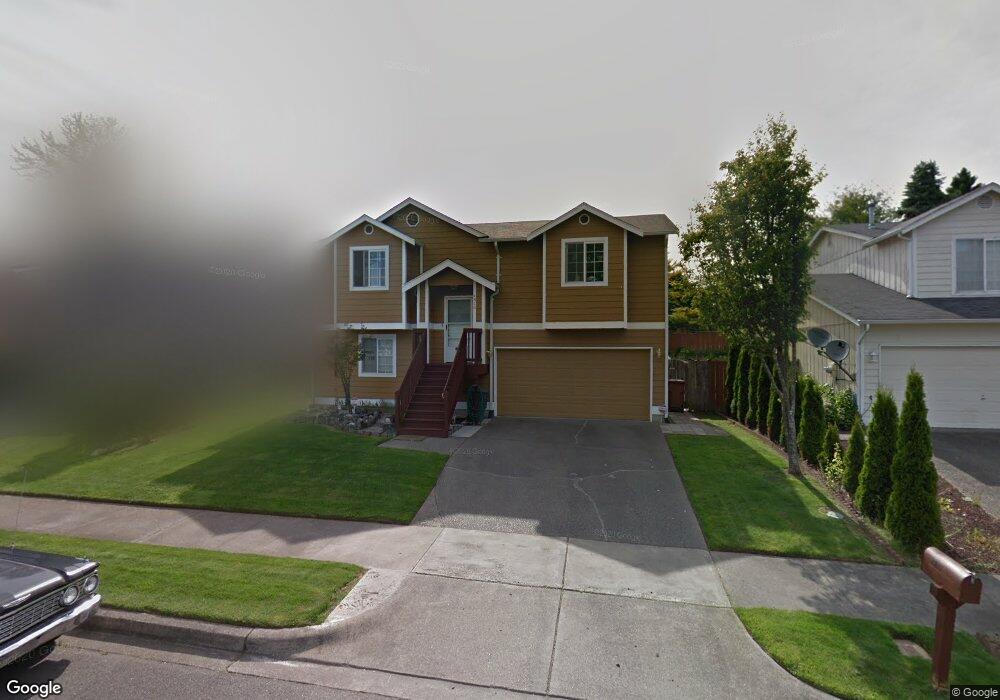
4810 E D St Tacoma, WA 98404
Eastside NeighborhoodEstimated Value: $472,720 - $495,000
4
Beds
2
Baths
1,472
Sq Ft
$327/Sq Ft
Est. Value
About This Home
This home is located at 4810 E D St, Tacoma, WA 98404 and is currently estimated at $480,930, approximately $326 per square foot. 4810 E D St is a home located in Pierce County with nearby schools including Lyon, Hunt Middle School, and Lincoln High School.
Ownership History
Date
Name
Owned For
Owner Type
Purchase Details
Closed on
Jun 5, 1997
Sold by
Kerr Hansen Corp
Bought by
Broughton Nathaniel A and Broughton Debra A
Current Estimated Value
Home Financials for this Owner
Home Financials are based on the most recent Mortgage that was taken out on this home.
Original Mortgage
$122,335
Outstanding Balance
$17,506
Interest Rate
7.98%
Mortgage Type
VA
Estimated Equity
$463,424
Create a Home Valuation Report for This Property
The Home Valuation Report is an in-depth analysis detailing your home's value as well as a comparison with similar homes in the area
Home Values in the Area
Average Home Value in this Area
Purchase History
| Date | Buyer | Sale Price | Title Company |
|---|---|---|---|
| Broughton Nathaniel A | $142,320 | -- |
Source: Public Records
Mortgage History
| Date | Status | Borrower | Loan Amount |
|---|---|---|---|
| Open | Broughton Nathaniel A | $122,335 |
Source: Public Records
Tax History
| Year | Tax Paid | Tax Assessment Tax Assessment Total Assessment is a certain percentage of the fair market value that is determined by local assessors to be the total taxable value of land and additions on the property. | Land | Improvement |
|---|---|---|---|---|
| 2025 | $4,540 | $456,100 | $184,100 | $272,000 |
| 2024 | $4,540 | $431,300 | $173,800 | $257,500 |
| 2023 | $4,540 | $407,700 | $165,300 | $242,400 |
| 2022 | $4,416 | $450,900 | $179,900 | $271,000 |
| 2021 | $3,948 | $314,000 | $107,100 | $206,900 |
| 2019 | $3,362 | $285,500 | $89,500 | $196,000 |
| 2018 | $3,696 | $258,600 | $72,000 | $186,600 |
| 2017 | $3,266 | $233,900 | $62,500 | $171,400 |
| 2016 | $2,784 | $173,800 | $46,300 | $127,500 |
| 2014 | $2,460 | $160,100 | $45,600 | $114,500 |
| 2013 | $2,460 | $145,900 | $40,000 | $105,900 |
Source: Public Records
Map
Nearby Homes
Your Personal Tour Guide
Ask me questions while you tour the home.