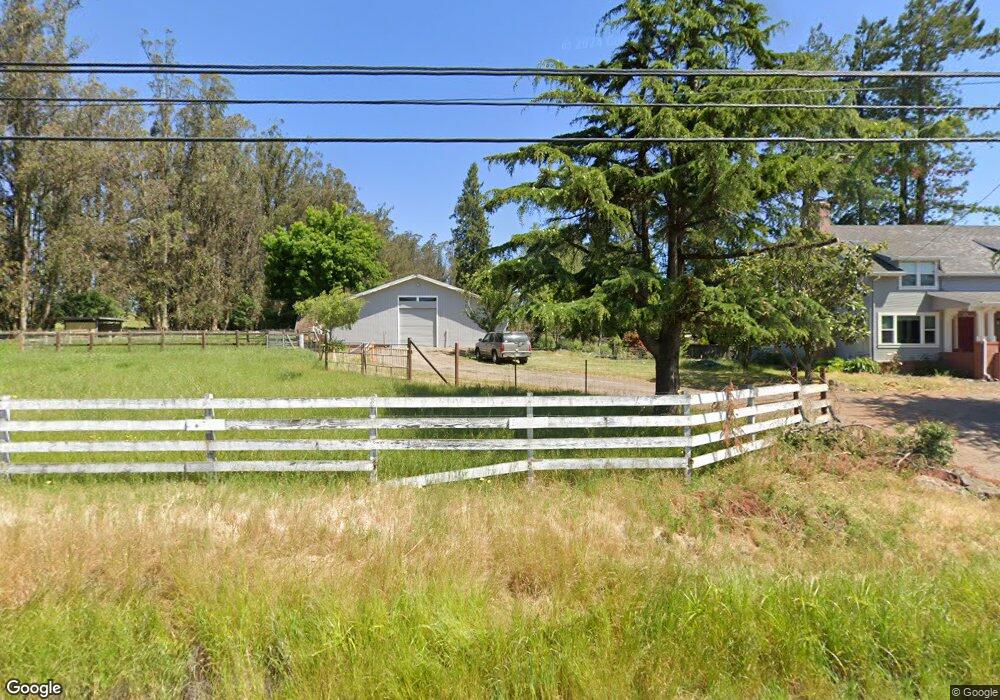
4810 Roblar Rd Petaluma, CA 94952
Estimated Value: $1,398,000 - $2,046,000
5
Beds
3
Baths
2,712
Sq Ft
$621/Sq Ft
Est. Value
About This Home
This home is located at 4810 Roblar Rd, Petaluma, CA 94952 and is currently estimated at $1,683,657, approximately $620 per square foot. 4810 Roblar Rd is a home located in Sonoma County with nearby schools including Dunham Elementary School, Petaluma Junior High School, and Petaluma High School.
Ownership History
Date
Name
Owned For
Owner Type
Purchase Details
Closed on
Nov 17, 2011
Sold by
U S Bank National Association
Bought by
Tunzi James M and Tunzi Joan E
Current Estimated Value
Purchase Details
Closed on
Oct 12, 2011
Sold by
Mccurdy Linda P
Bought by
U S Bank National Association
Purchase Details
Closed on
Jul 20, 2006
Sold by
Mccurdy Linda P
Bought by
Mccurdy Linda P
Home Financials for this Owner
Home Financials are based on the most recent Mortgage that was taken out on this home.
Original Mortgage
$962,000
Interest Rate
6.87%
Mortgage Type
Unknown
Purchase Details
Closed on
Jul 18, 2006
Sold by
Mossina Elizabeth and Parker Brown Kathie M
Bought by
Mccurdy Linda P
Home Financials for this Owner
Home Financials are based on the most recent Mortgage that was taken out on this home.
Original Mortgage
$962,000
Interest Rate
6.87%
Mortgage Type
Unknown
Purchase Details
Closed on
Feb 5, 1998
Sold by
Pansini Andrew L
Bought by
Mossina Elizabeth and Parker Brown Kathie M
Home Financials for this Owner
Home Financials are based on the most recent Mortgage that was taken out on this home.
Original Mortgage
$402,000
Interest Rate
6.9%
Create a Home Valuation Report for This Property
The Home Valuation Report is an in-depth analysis detailing your home's value as well as a comparison with similar homes in the area
Home Values in the Area
Average Home Value in this Area
Purchase History
| Date | Buyer | Sale Price | Title Company |
|---|---|---|---|
| Tunzi James M | $749,000 | Lawyers Title Company | |
| U S Bank National Association | $510,300 | Lawyers Title Company | |
| Mccurdy Linda P | -- | Fidelity National Title Co | |
| Mccurdy Linda P | $1,375,000 | Fidelity National Title Co | |
| Mossina Elizabeth | $536,500 | Old Republic Title Company |
Source: Public Records
Mortgage History
| Date | Status | Borrower | Loan Amount |
|---|---|---|---|
| Previous Owner | Mccurdy Linda P | $962,000 | |
| Previous Owner | Mossina Elizabeth | $402,000 |
Source: Public Records
Tax History Compared to Growth
Tax History
| Year | Tax Paid | Tax Assessment Tax Assessment Total Assessment is a certain percentage of the fair market value that is determined by local assessors to be the total taxable value of land and additions on the property. | Land | Improvement |
|---|---|---|---|---|
| 2025 | $10,076 | $940,776 | $376,811 | $563,965 |
| 2024 | $10,076 | $922,330 | $369,423 | $552,907 |
| 2023 | $10,076 | $904,246 | $362,180 | $542,066 |
| 2022 | $9,817 | $886,517 | $355,079 | $531,438 |
| 2021 | $9,601 | $869,135 | $348,117 | $521,018 |
| 2020 | $9,678 | $860,224 | $344,548 | $515,676 |
| 2019 | $9,329 | $843,358 | $337,793 | $505,565 |
| 2018 | $9,265 | $826,822 | $331,170 | $495,652 |
| 2017 | $9,110 | $810,611 | $324,677 | $485,934 |
| 2016 | $8,819 | $794,717 | $318,311 | $476,406 |
| 2015 | $8,603 | $782,780 | $313,530 | $469,250 |
| 2014 | $8,498 | $767,448 | $307,389 | $460,059 |
Source: Public Records
Map
Nearby Homes
- 6675 Petersen Rd
- 6000 Petersen Rd
- 5611 Blank Rd
- 4720 Paulsen Ln
- 5601 S Gravenstein Hwy
- 5227 Wendell Ln
- 5300 Gravenstein Hwy S
- 5414 Hessel Ave
- 2705 Roblar Rd
- 4952 Gravenstein Hwy S
- 5190 Volkerts Rd
- 4389 Hessel Ct
- 4641 Daywalt Rd
- 6067 Gilmore Ave
- 5301 Hutchinson Rd
- 5816 Lowell Ct
- 6060 Oak Ave
- 4290 Gravenstein Hwy S
- 5152 Mcfarlane Rd
- 3920 Gravenstein Hwy S
- 4800 Roblar Rd
- 4708 Roblar Rd
- 6000 Orchard Station Rd
- 4980 Roblar Rd
- 5987 Orchard Station Rd
- 6020 Orchard Station Rd
- 6050 Orchard Station Rd
- 4590 Roblar Rd
- 6001 Orchard Station Rd
- 4560 Roblar Rd
- 4550 Roblar Rd
- 7160 Orchard Station Rd
- 4505 Roblar Rd
- 4500 Roblar Rd
- 6610 Orchard Station Rd
- 6680 Orchard Station Rd
- 5997 Orchard Station Rd
- 5995 Orchard Station Rd
- 4422 Roblar Rd
- 7159 Orchard Station Rd