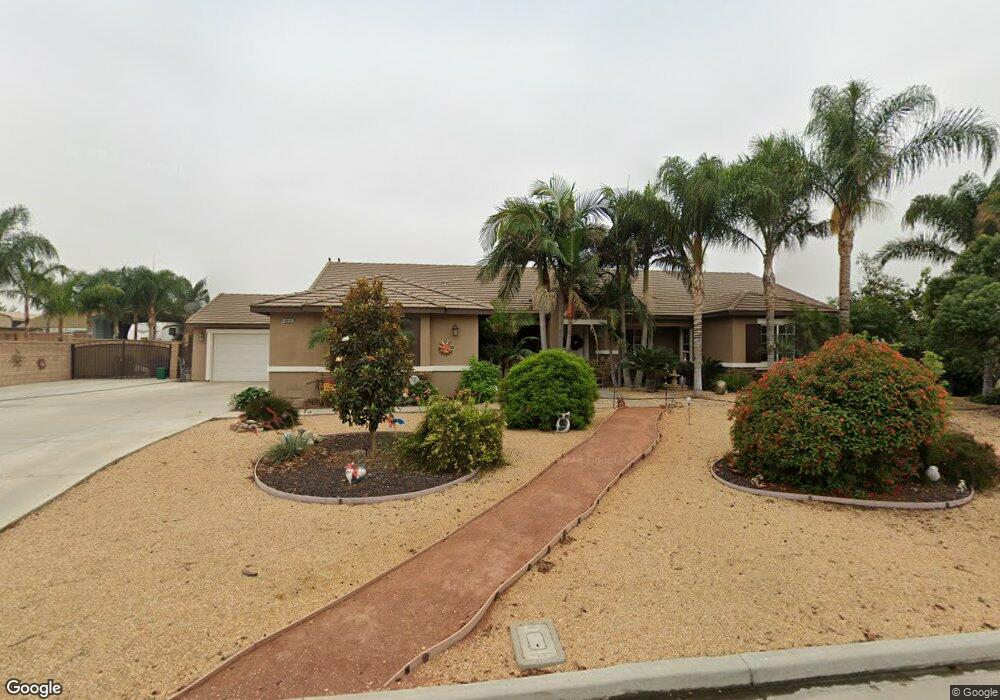
4810 Rockingham Loop Riverside, CA 92509
Estimated Value: $933,672 - $1,203,000
About This Home
This home is located at 4810 Rockingham Loop, Riverside, CA 92509 and is currently estimated at $1,051,418, approximately $322 per square foot. 4810 Rockingham Loop is a home located in Riverside County with nearby schools including Van Buren Elementary School, Mira Loma Middle School, and Jurupa Valley High School.
Ownership History
We collect this data history from publicly available records. To have your information removed, we recommend requesting removal directly through your county’s website.
Purchase Details
Purchase Details
Home Financials for this Owner
Home Financials are based on the most recent Mortgage that was taken out on this home.Home Values in the Area
Average Home Value in this Area
Purchase History
We collect this data history from publicly available records. To have your information removed, we recommend requesting removal directly through your county’s website.
| Date | Buyer | Sale Price | Title Company |
|---|---|---|---|
| -- | None Available | ||
| -- | None Available | ||
| -- | None Available | ||
| $387,000 | Orange Coast Title Company |
Mortgage History
We collect this data history from publicly available records. To have your information removed, we recommend requesting removal directly through your county’s website.
| Date | Status | Borrower | Loan Amount |
|---|---|---|---|
| Previous Owner | $186,990 |
Tax History
We collect this data history from publicly available records. To have your information removed, we recommend requesting removal directly through your county’s website.
| Year | Tax Paid | Tax Assessment Tax Assessment Total Assessment is a certain percentage of the fair market value that is determined by local assessors to be the total taxable value of land and additions on the property. | Land | Improvement |
|---|---|---|---|---|
| 2025 | $4,371 | $236,903 | $72,345 | $164,558 |
| 2023 | $4,371 | $227,706 | $69,537 | $158,169 |
| 2022 | $4,212 | $223,242 | $68,174 | $155,068 |
| 2021 | $4,142 | $218,866 | $66,838 | $152,028 |
| 2020 | $4,085 | $216,623 | $66,153 | $150,470 |
| 2019 | $4,014 | $212,376 | $64,856 | $147,520 |
| 2018 | $3,921 | $208,213 | $63,586 | $144,627 |
| 2017 | $3,856 | $204,132 | $62,340 | $141,792 |
| 2016 | $3,796 | $200,130 | $61,118 | $139,012 |
| 2015 | $3,740 | $197,125 | $60,200 | $136,925 |
| 2014 | $3,555 | $193,266 | $59,022 | $134,244 |
Map
- 9985 Willowbrook Rd
- 4767 Bain St
- 4721 Marlatt St
- 9931 Union St
- 10312 Jurupa Rd
- 6165 Dodd St
- 9550 52nd St
- 9542 52nd St
- 4052 Lindsay St
- 10044 Mission Blvd
- 5484 Street Cedar
- 10275 56th St
- 5445 Cedar St
- 10538 54th St
- 5506 Troth St
- 5641 Rutile St
- 0 Felspar St Unit DW25190204
- 9142 Johnson Ct
- 0 Appaloosa Ave
- 10621 Jurupa Rd
- 4828 Rockingham Loop
- 4792 Rockingham Loop
- 10079 Woodbridge Ln
- 10061 Woodbridge Ln
- 10097 Woodbridge Ln
- 4819 Rockingham Loop
- 4801 Rockingham Loop
- 4774 Rockingham Loop
- 4846 Rockingham Loop
- 4837 Rockingham Loop
- 4765 Rockingham Loop
- 10043 Woodbridge Ln
- 10133 Woodbridge Ln
- 10104 Kings Ct
- 10070 Woodbridge Ln
- 4855 Rockingham Loop
- 10140 Kings Ct
- 10088 Woodbridge Ln
- 4756 Rockingham Loop
- 10052 Woodbridge Ln
Ask me questions while you tour the home.