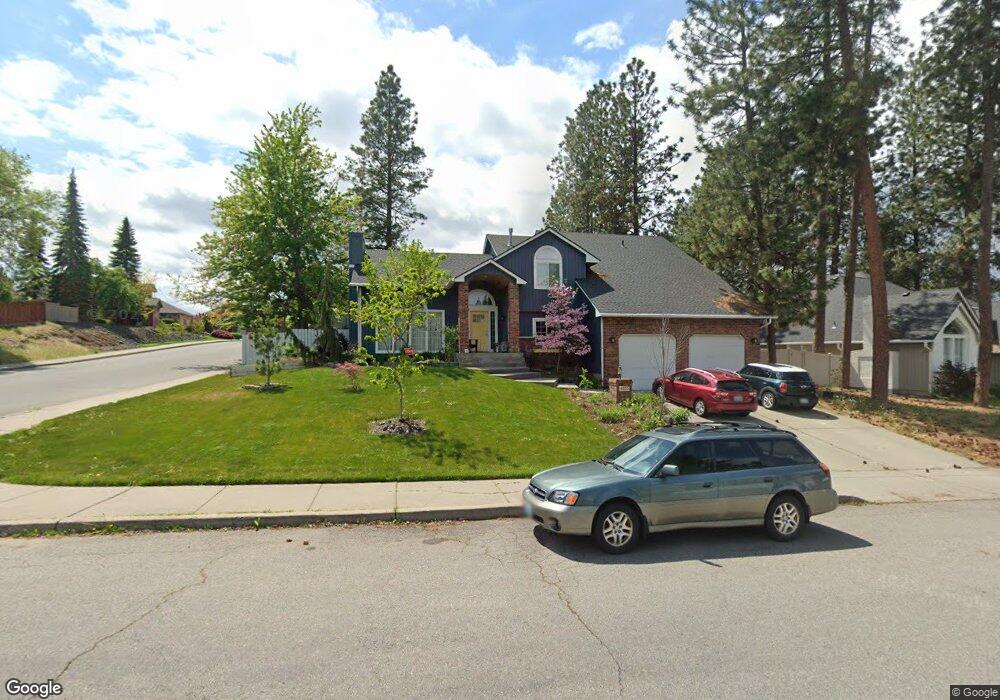
4810 S Myrtle St Unit 1607 Spokane, WA 99223
Moran Prairie NeighborhoodEstimated Value: $609,719 - $671,000
4
Beds
3
Baths
2,615
Sq Ft
$245/Sq Ft
Est. Value
About This Home
This home is located at 4810 S Myrtle St Unit 1607, Spokane, WA 99223 and is currently estimated at $639,680, approximately $244 per square foot. 4810 S Myrtle St Unit 1607 is a home located in Spokane County with nearby schools including Moran Prairie Elementary School, Chase Middle School, and Ferris High School.
Ownership History
Date
Name
Owned For
Owner Type
Purchase Details
Closed on
Jul 10, 2018
Sold by
Gehrett Jesse A and Gehrett Alexandra
Bought by
Manley Scott A and Manley Elisabeth R
Current Estimated Value
Home Financials for this Owner
Home Financials are based on the most recent Mortgage that was taken out on this home.
Original Mortgage
$3,032,000
Outstanding Balance
$2,627,681
Interest Rate
4.5%
Mortgage Type
New Conventional
Estimated Equity
-$1,988,001
Purchase Details
Closed on
Jun 18, 2015
Sold by
Rickard Robert W and Rickard Karen R
Bought by
Gehrett Jesse A and Gehrett Alexandra
Home Financials for this Owner
Home Financials are based on the most recent Mortgage that was taken out on this home.
Original Mortgage
$246,600
Interest Rate
3.77%
Mortgage Type
New Conventional
Create a Home Valuation Report for This Property
The Home Valuation Report is an in-depth analysis detailing your home's value as well as a comparison with similar homes in the area
Home Values in the Area
Average Home Value in this Area
Purchase History
| Date | Buyer | Sale Price | Title Company |
|---|---|---|---|
| Manley Scott A | $379,000 | Ticor Title Co | |
| Gehrett Jesse A | $274,000 | Spokane County Title Company |
Source: Public Records
Mortgage History
| Date | Status | Borrower | Loan Amount |
|---|---|---|---|
| Open | Manley Scott A | $3,032,000 | |
| Previous Owner | Gehrett Jesse A | $246,600 |
Source: Public Records
Tax History Compared to Growth
Tax History
| Year | Tax Paid | Tax Assessment Tax Assessment Total Assessment is a certain percentage of the fair market value that is determined by local assessors to be the total taxable value of land and additions on the property. | Land | Improvement |
|---|---|---|---|---|
| 2025 | $5,914 | $557,600 | $120,000 | $437,600 |
| 2024 | $5,914 | $596,600 | $115,000 | $481,600 |
| 2023 | $6,110 | $625,400 | $100,000 | $525,400 |
| 2022 | $5,376 | $625,400 | $100,000 | $525,400 |
| 2021 | $4,938 | $415,600 | $60,000 | $355,600 |
| 2020 | $4,507 | $365,400 | $50,000 | $315,400 |
| 2019 | $3,969 | $332,200 | $38,000 | $294,200 |
| 2018 | $4,335 | $311,800 | $38,000 | $273,800 |
| 2017 | $3,978 | $291,400 | $38,000 | $253,400 |
| 2016 | $3,156 | $226,100 | $38,000 | $188,100 |
| 2015 | $3,135 | $219,700 | $38,000 | $181,700 |
| 2014 | -- | $215,400 | $38,000 | $177,400 |
| 2013 | -- | $0 | $0 | $0 |
Source: Public Records
Map
Nearby Homes
- 4368 S Greystone Ln
- 3507 E 47th Ave
- NNA E 10th Ave
- 3408 E 48th Ct
- 3453 E 46th Ct
- 4222 S Bellgrove Ln
- 5313 S Myrtle Ln
- 4413 E North Glenngrae Ln
- 5110 S Glenngrae Ct
- 4121 S Bellegrove Ln
- 10818 E 51st Ln
- 10812 E 51st Ln
- 10906 E 51st Ln
- 5024 E Glenngrae Ln
- 4420 E 51st Ln
- 10920 E 51st Ln
- 4105 S Cuba St
- 4108 S Greystone Ln
- 4520 E North Glenngrae Ln
- 4010 S Cuba St
- 4810 S Myrtle St
- 4806 S Myrtle St
- 3907 E Sumac Dr
- 4812 S Myrtle St
- 4001 E Sumac Dr
- 3914 E 48th Ave
- 3910 E 48th Ave
- 3903 E Sumac Dr
- 4705 S Tampa Dr
- 4822 S Myrtle St
- 4000 E Sumac Dr
- 3908 E Sumac Dr
- 4003 E Sumac Dr
- 3906 E 48th Ave
- 3829 E Sumac Dr
- 4701 S Tampa Dr
- 3915 E 48th Ave
- 4704 S Tampa Dr
- 4704 S Tampa Dr
- 4821 S Myrtle St