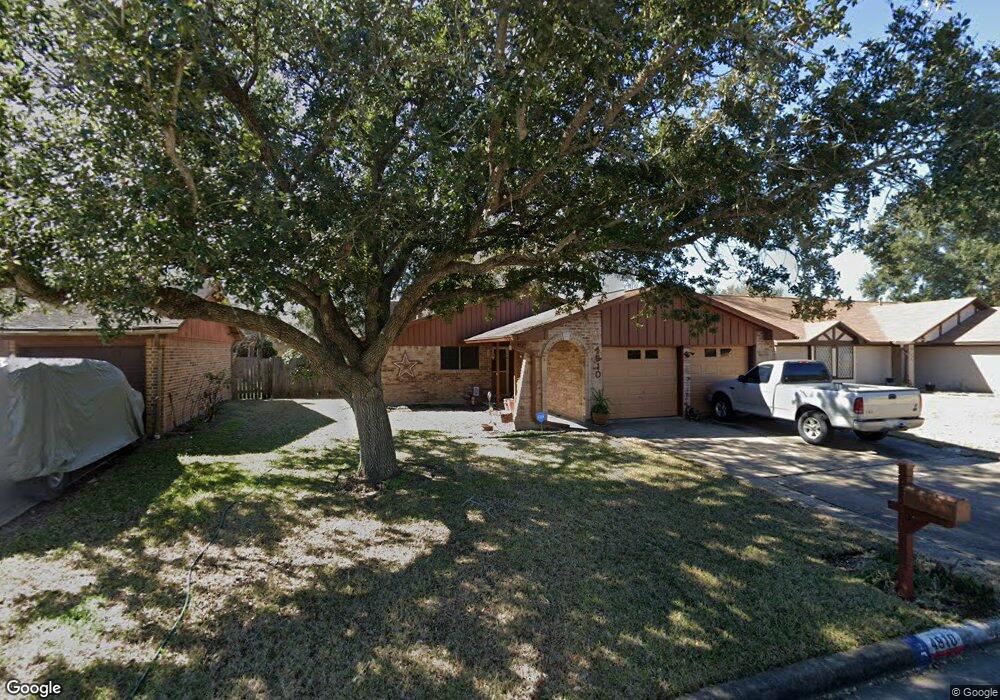
4810 Sandalwood Ave Rosenberg, TX 77471
Estimated Value: $207,866 - $233,000
3
Beds
2
Baths
1,167
Sq Ft
$187/Sq Ft
Est. Value
About This Home
This home is located at 4810 Sandalwood Ave, Rosenberg, TX 77471 and is currently estimated at $217,717, approximately $186 per square foot. 4810 Sandalwood Ave is a home located in Fort Bend County with nearby schools including Travis Elementary School, Navarro Middle School, and George Junior High School.
Ownership History
Date
Name
Owned For
Owner Type
Purchase Details
Closed on
Jun 22, 2012
Sold by
White Eva and White Billy Ray
Bought by
Diggs Rosalind M
Current Estimated Value
Home Financials for this Owner
Home Financials are based on the most recent Mortgage that was taken out on this home.
Original Mortgage
$86,307
Outstanding Balance
$59,589
Interest Rate
3.75%
Mortgage Type
FHA
Estimated Equity
$158,128
Purchase Details
Closed on
Oct 28, 1996
Sold by
Bynum Barry L
Bought by
Diggs Rosalind M
Home Financials for this Owner
Home Financials are based on the most recent Mortgage that was taken out on this home.
Original Mortgage
$57,100
Interest Rate
8.15%
Purchase Details
Closed on
Oct 25, 1996
Sold by
Bynum Barry L and Bynum Ellen M
Bought by
White Billy Ray and White Eva
Home Financials for this Owner
Home Financials are based on the most recent Mortgage that was taken out on this home.
Original Mortgage
$57,100
Interest Rate
8.15%
Create a Home Valuation Report for This Property
The Home Valuation Report is an in-depth analysis detailing your home's value as well as a comparison with similar homes in the area
Home Values in the Area
Average Home Value in this Area
Purchase History
| Date | Buyer | Sale Price | Title Company |
|---|---|---|---|
| Diggs Rosalind M | -- | Great American Title | |
| Diggs Rosalind M | -- | -- | |
| White Billy Ray | -- | American Title Co |
Source: Public Records
Mortgage History
| Date | Status | Borrower | Loan Amount |
|---|---|---|---|
| Open | Diggs Rosalind M | $86,307 | |
| Previous Owner | White Billy Ray | $57,100 |
Source: Public Records
Tax History Compared to Growth
Tax History
| Year | Tax Paid | Tax Assessment Tax Assessment Total Assessment is a certain percentage of the fair market value that is determined by local assessors to be the total taxable value of land and additions on the property. | Land | Improvement |
|---|---|---|---|---|
| 2025 | $2,148 | $193,500 | $27,300 | $166,200 |
| 2024 | $2,148 | $189,317 | -- | $194,068 |
| 2023 | $1,904 | $172,106 | $0 | $192,432 |
| 2022 | $2,456 | $156,460 | $0 | $162,300 |
| 2021 | $2,951 | $142,240 | $21,000 | $121,240 |
| 2020 | $2,744 | $129,310 | $19,000 | $110,310 |
| 2019 | $2,927 | $128,160 | $19,000 | $109,160 |
| 2018 | $2,704 | $116,510 | $19,000 | $97,510 |
| 2017 | $2,472 | $105,920 | $19,000 | $86,920 |
| 2016 | $2,247 | $96,290 | $19,000 | $77,290 |
| 2015 | $1,598 | $87,540 | $19,000 | $68,540 |
| 2014 | $1,578 | $79,580 | $19,000 | $60,580 |
Source: Public Records
Map
Nearby Homes
- 4717 Woodway Ave
- 1816 Spruce Dr
- 4605 Greenwood Dr
- 1733 Brumbelow St
- 1921 Ripple Creek Dr
- 1711 Klauke St
- 1633 Jones St
- 5106 Alderney Ct
- 1403 Divin Dr
- 1803 Jones St
- 5824 Homestead Rd
- 5121 Alderney Ct
- 4707 E Parma Dr
- 2126 Ripple Creek Dr
- 1926 Klauke Ct
- 1230 Law Ct
- 6306 Milam Branch Ln
- 3608 Avenue R
- 3604 Rychlik Dr
- 1504 Radio Ln
- 4814 Sandalwood Ave
- 4806 Sandalwood Ave
- 4818 Sandalwood Ave
- 4805 Woodway Ave
- 4801 Woodway Ave
- 4809 Woodway Ave
- 2101 Palm Ct
- 2105 Palm Ct
- 4809 Sandalwood Ave
- 4822 Sandalwood Ave
- 4813 Sandalwood Ave
- 4813 Woodway Ave
- 4713 Woodway Ave
- 4805 Sandalwood Ave
- 4817 Sandalwood Ave
- 4801 Sandalwood Ave
- 4817 Woodway Ave
- 4709 Woodway Ave
- 4821 Sandalwood Ave
- 4900 Sandalwood Ave