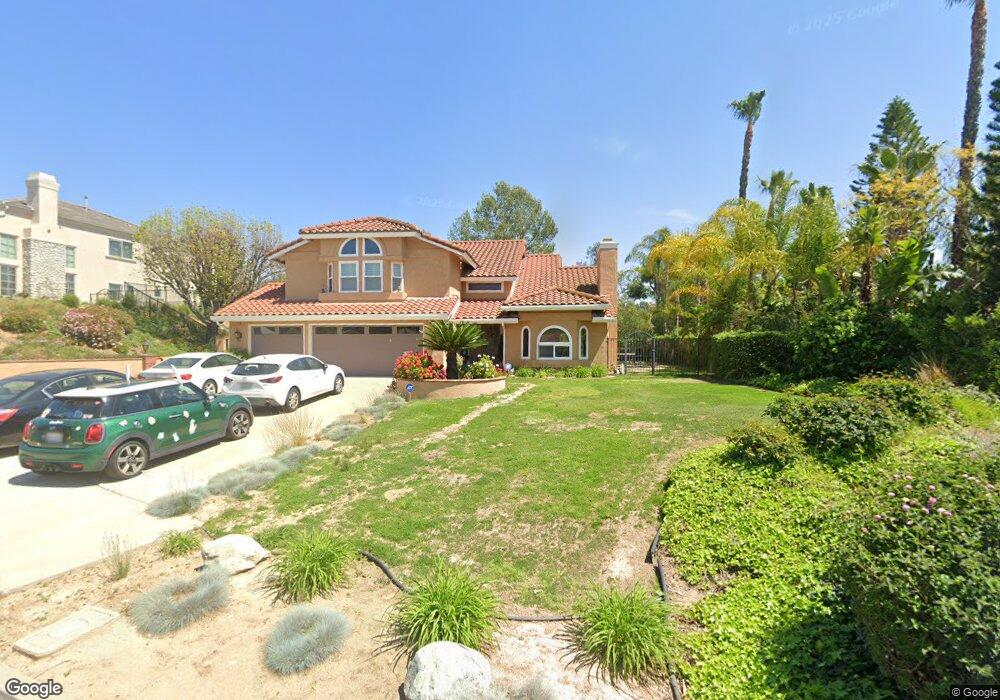
4810 Via Del Corral Yorba Linda, CA 92887
Estimated Value: $1,755,766 - $2,174,000
4
Beds
3
Baths
3,069
Sq Ft
$641/Sq Ft
Est. Value
About This Home
This home is located at 4810 Via Del Corral, Yorba Linda, CA 92887 and is currently estimated at $1,966,192, approximately $640 per square foot. 4810 Via Del Corral is a home located in Orange County with nearby schools including Travis Ranch Middle School, Yorba Linda High School, and Ivycrest Montessori Private School - Yorba Linda.
Ownership History
Date
Name
Owned For
Owner Type
Purchase Details
Closed on
Jan 27, 2016
Sold by
Huynh Eric L
Bought by
Huynh Eric L and The Eric L Huynh Trust
Current Estimated Value
Purchase Details
Closed on
Jan 26, 2016
Sold by
Huynh Loanne Marie
Bought by
Huynh Loanne Marie and The Loanne Marie Huynh Trust
Purchase Details
Closed on
Nov 19, 2011
Sold by
Huynh Eric L and Huynh Loanne Marie
Bought by
Huynh Eric L and Huynh Loanne Marie
Purchase Details
Closed on
Dec 27, 1999
Sold by
Costa Robert J and Costa Eileen M
Bought by
Huynh Eric Linh Mai and Huynh Loanne Marie
Home Financials for this Owner
Home Financials are based on the most recent Mortgage that was taken out on this home.
Original Mortgage
$350,000
Outstanding Balance
$112,208
Interest Rate
7.96%
Estimated Equity
$1,853,984
Create a Home Valuation Report for This Property
The Home Valuation Report is an in-depth analysis detailing your home's value as well as a comparison with similar homes in the area
Home Values in the Area
Average Home Value in this Area
Purchase History
| Date | Buyer | Sale Price | Title Company |
|---|---|---|---|
| Huynh Eric L | -- | None Available | |
| Huynh Eric L | -- | None Available | |
| Huynh Loanne Marie | -- | None Available | |
| Huynh Eric L | -- | None Available | |
| Huynh Eric L | -- | None Available | |
| Huynh Eric Linh Mai | $535,000 | -- |
Source: Public Records
Mortgage History
| Date | Status | Borrower | Loan Amount |
|---|---|---|---|
| Open | Huynh Eric Linh Mai | $350,000 | |
| Closed | Huynh Eric Linh Mai | $78,000 |
Source: Public Records
Tax History Compared to Growth
Tax History
| Year | Tax Paid | Tax Assessment Tax Assessment Total Assessment is a certain percentage of the fair market value that is determined by local assessors to be the total taxable value of land and additions on the property. | Land | Improvement |
|---|---|---|---|---|
| 2025 | $9,614 | $822,280 | $532,859 | $289,421 |
| 2024 | $9,614 | $806,157 | $522,410 | $283,747 |
| 2023 | $9,439 | $790,350 | $512,166 | $278,184 |
| 2022 | $9,327 | $774,853 | $502,123 | $272,730 |
| 2021 | $9,156 | $759,660 | $492,277 | $267,383 |
| 2020 | $9,057 | $751,871 | $487,229 | $264,642 |
| 2019 | $8,740 | $737,129 | $477,676 | $259,453 |
| 2018 | $8,538 | $722,676 | $468,310 | $254,366 |
| 2017 | $8,477 | $708,506 | $459,127 | $249,379 |
| 2016 | $8,234 | $694,614 | $450,124 | $244,490 |
| 2015 | $8,135 | $684,181 | $443,363 | $240,818 |
| 2014 | $7,898 | $670,779 | $434,678 | $236,101 |
Source: Public Records
Map
Nearby Homes
- 4811 Rideline Rd
- 21417 Zaca Ct
- 21620 Brisbane Way
- 21451 Cloud Ridge
- 21630 Dunrobin Way
- 5000 Stonehaven Dr
- 20681 Via Amarilla
- 20709 Calle Pera
- 20660 Calle Feliz
- 21925 Heatheridge Dr
- 5317 Via Ramon Rd
- 20640 Smoketree Ave
- 21290 Clear Haven Dr
- 21590 Via Pepita
- 3971 Hollow Ridge Ct
- 4152 Beech Ave
- 5685 Avenida Florencia
- 5795 Via Perla
- 5851 Via Santana
- 5505 Calle Vista Linda
- 4800 Via Del Corral
- 4820 Via Del Corral
- 4830 Via Del Corral
- 4785 Via de la Roca
- 4815 Via Del Corral
- 4825 Via Del Corral
- 4805 Via Del Corral
- 4790 Via de la Roca
- 4840 Via Del Corral
- 4795 Via de la Roca
- 4835 Via Del Corral
- 4865 Via Del Corral
- 4855 Via Del Corral
- 4845 Via Del Corral
- 4730 Dorinda Rd
- 4800 Via de la Roca
- 4875 Via Del Corral
- 4740 Dorinda Rd
- 4750 Dorinda Rd
- 4710 Dorinda Rd