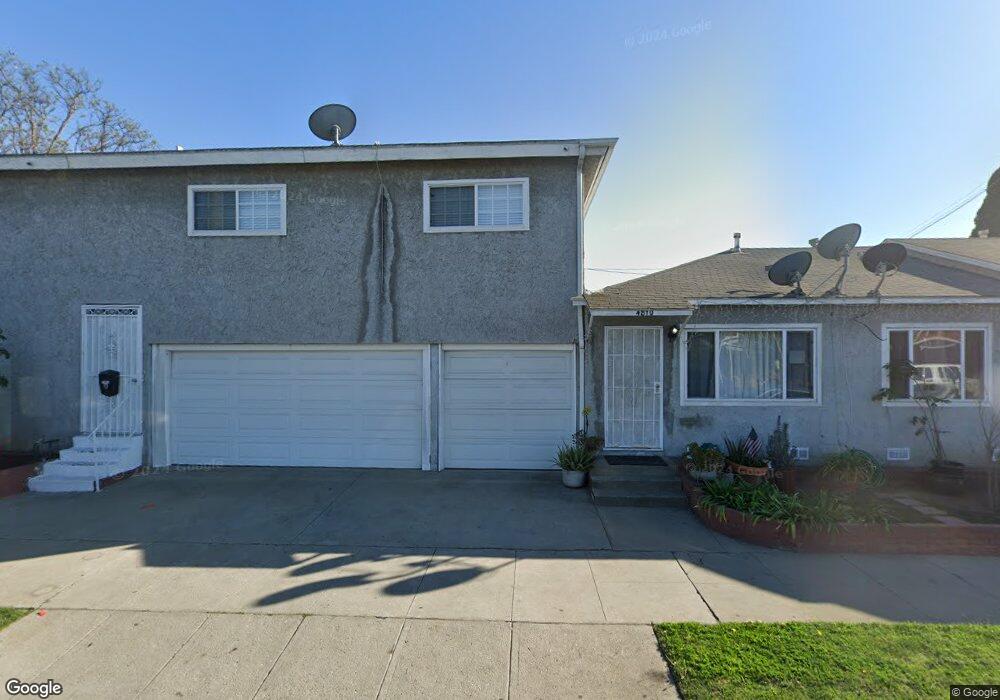
4810 W 115th St Hawthorne, CA 90250
Estimated Value: $1,137,000 - $1,356,000
6
Beds
5
Baths
3,346
Sq Ft
$383/Sq Ft
Est. Value
About This Home
This home is located at 4810 W 115th St, Hawthorne, CA 90250 and is currently estimated at $1,281,831, approximately $383 per square foot. 4810 W 115th St is a home located in Los Angeles County with nearby schools including Eucalyptus School, Hawthorne Middle School, and Hawthorne High School.
Ownership History
Date
Name
Owned For
Owner Type
Purchase Details
Closed on
Jan 24, 2019
Sold by
Jose And Olivia Diaz Family Trust and Diaz Olivia
Bought by
Diaz Susana
Current Estimated Value
Purchase Details
Closed on
Jan 8, 2019
Sold by
Flores Jose Diaz and Diaz Olivia Esparza De
Bought by
Flores Jose Diaz and Diaz Olivia Esparza De
Purchase Details
Closed on
Feb 9, 2017
Sold by
Diaz Susana
Bought by
Diaz Jose and Diaz Olivia
Purchase Details
Closed on
Jun 11, 2010
Sold by
Tatum Kenji Jimmy
Bought by
Diaz Susana
Home Financials for this Owner
Home Financials are based on the most recent Mortgage that was taken out on this home.
Original Mortgage
$522,957
Interest Rate
4.37%
Mortgage Type
FHA
Purchase Details
Closed on
Dec 30, 2008
Sold by
Tatum Kenji Jimmy
Bought by
Tatum Kenji Jimmy
Purchase Details
Closed on
Oct 8, 2004
Sold by
Tatum James R
Bought by
Tatum James R and The James R Tatum Revocable Li
Create a Home Valuation Report for This Property
The Home Valuation Report is an in-depth analysis detailing your home's value as well as a comparison with similar homes in the area
Home Values in the Area
Average Home Value in this Area
Purchase History
| Date | Buyer | Sale Price | Title Company |
|---|---|---|---|
| Diaz Susana | -- | None Listed On Document | |
| Diaz Susana | -- | None Available | |
| Flores Jose Diaz | -- | None Available | |
| Diaz Jose | -- | None Available | |
| Diaz Susana | $530,000 | Usa National Title Company | |
| Tatum Kenji Jimmy | -- | None Available | |
| Tatum James R | -- | -- |
Source: Public Records
Mortgage History
| Date | Status | Borrower | Loan Amount |
|---|---|---|---|
| Previous Owner | Diaz Susana | $522,957 |
Source: Public Records
Tax History Compared to Growth
Tax History
| Year | Tax Paid | Tax Assessment Tax Assessment Total Assessment is a certain percentage of the fair market value that is determined by local assessors to be the total taxable value of land and additions on the property. | Land | Improvement |
|---|---|---|---|---|
| 2025 | $9,156 | $684,124 | $348,515 | $335,609 |
| 2024 | $9,156 | $670,711 | $341,682 | $329,029 |
| 2023 | $8,834 | $657,561 | $334,983 | $322,578 |
| 2022 | $8,951 | $644,668 | $328,415 | $316,253 |
| 2021 | $8,830 | $632,028 | $321,976 | $310,052 |
| 2020 | $8,804 | $625,973 | $318,675 | $307,298 |
| 2019 | $8,529 | $824,421 | $312,120 | $512,301 |
| 2018 | $10,736 | $808,265 | $306,000 | $502,265 |
| 2016 | $7,777 | $577,912 | $294,408 | $283,504 |
| 2015 | $7,604 | $569,232 | $289,986 | $279,246 |
| 2014 | $7,577 | $558,082 | $284,306 | $273,776 |
Source: Public Records
Map
Nearby Homes
- 4831 W 112th St
- 11835 Gale Ave
- 11431 Ramona Ave
- 4834 W 118th Place
- 5017 W 118th Place
- 11894 Truro Ave
- 11830 Manor Dr Unit A
- 11000 S Inglewood Ave
- 11000 Buford Ave
- 4707 W 120th St
- 10910 S Burl Ave
- 11004 Mansel Ave
- 4366 W 116th St
- 4900 Lennox Blvd
- 5048 W 121st St
- 10928 Burin Ave
- 10517 Firmona Ave
- 11121 S Freeman Ave
- 10413 Buford Ave
- 5414 W 118th Place
- 11505 Inglewood Ave
- 11509 Inglewood Ave
- 4816 W 115th St
- 11513 Inglewood Ave
- 4822 W 115th St
- 4815 W 115th St
- 11517 Inglewood Ave
- 4824 W 115th St
- 11423 Inglewood Ave
- 11521 Inglewood Ave
- 4828 W 115th St
- 11510 Inglewood Ave
- 4815 W 116th St
- 11514 Inglewood Ave
- 4819 W 116th St
- 11518 Inglewood Ave
- 11424 Inglewood Ave
- 11525 Inglewood Ave
- 4832 W 115th St
- 4823 W 116th St