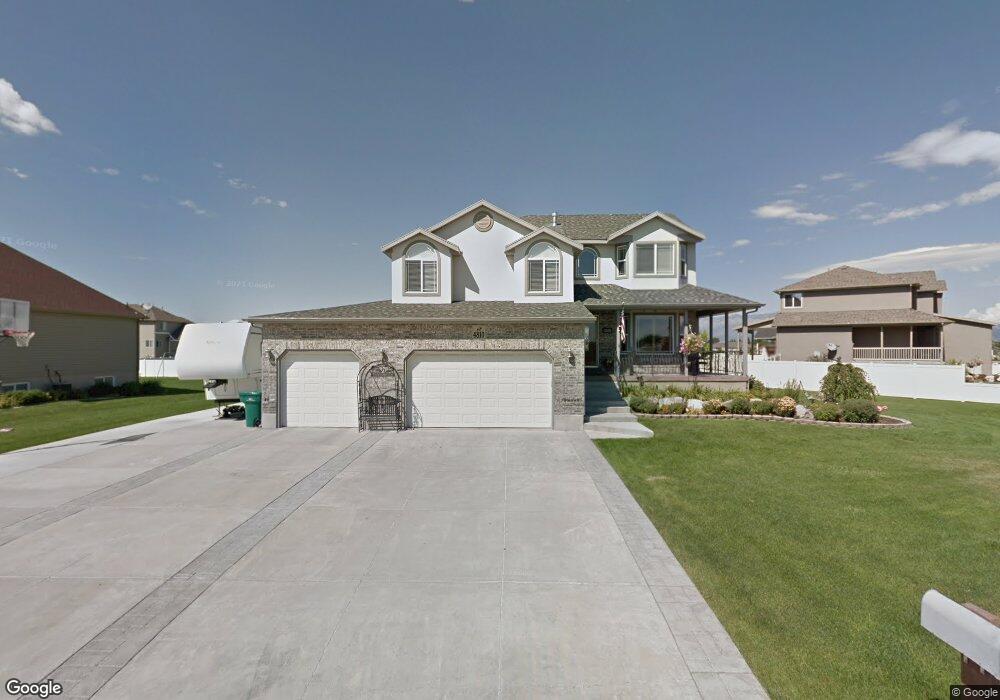
4810 W 4600 S West Haven, UT 84401
Estimated Value: $604,638 - $644,000
4
Beds
3
Baths
2,115
Sq Ft
$298/Sq Ft
Est. Value
About This Home
This home is located at 4810 W 4600 S, West Haven, UT 84401 and is currently estimated at $629,910, approximately $297 per square foot. 4810 W 4600 S is a home located in Weber County with nearby schools including Country View School, Rocky Mountain Junior High School, and Fremont High School.
Ownership History
Date
Name
Owned For
Owner Type
Purchase Details
Closed on
May 15, 2006
Sold by
Call Jeffrey K
Bought by
Call Jeffrey K and Call Cindy
Current Estimated Value
Purchase Details
Closed on
May 25, 2005
Sold by
Mike Schultz Construction Inc
Bought by
Call Jeffrey K
Purchase Details
Closed on
May 10, 2005
Sold by
Mike Schultz Construction Inc
Bought by
Call Jeffrey K
Create a Home Valuation Report for This Property
The Home Valuation Report is an in-depth analysis detailing your home's value as well as a comparison with similar homes in the area
Home Values in the Area
Average Home Value in this Area
Purchase History
| Date | Buyer | Sale Price | Title Company |
|---|---|---|---|
| Call Jeffrey K | -- | Us Title | |
| Call Jeffrey K | -- | U S Title Of Utah Ogden | |
| Call Jeffrey K | -- | -- |
Source: Public Records
Tax History Compared to Growth
Tax History
| Year | Tax Paid | Tax Assessment Tax Assessment Total Assessment is a certain percentage of the fair market value that is determined by local assessors to be the total taxable value of land and additions on the property. | Land | Improvement |
|---|---|---|---|---|
| 2025 | $3,365 | $551,308 | $169,687 | $381,621 |
| 2024 | $3,219 | $298,099 | $93,327 | $204,772 |
| 2023 | $3,370 | $314,050 | $93,328 | $220,722 |
| 2022 | $3,189 | $304,150 | $87,803 | $216,347 |
| 2021 | $2,705 | $432,000 | $74,791 | $357,209 |
| 2020 | $2,606 | $381,000 | $64,587 | $316,413 |
| 2019 | $2,567 | $355,000 | $57,137 | $297,863 |
| 2018 | $2,448 | $323,000 | $47,251 | $275,749 |
| 2017 | $2,251 | $287,000 | $57,163 | $229,837 |
| 2016 | $2,281 | $157,861 | $32,772 | $125,089 |
| 2015 | $2,208 | $151,904 | $32,772 | $119,132 |
| 2014 | $2,053 | $137,274 | $32,772 | $104,502 |
Source: Public Records
Map
Nearby Homes
- 4931 S 4700 W
- 4879 S 5050 W
- 4556 W 4950 S
- 3191 S 5100 St W Unit 1
- 4126 S 4950 W
- 4756 S 4300 W
- 4712 W 4100 S
- 4094 W 4700 S
- 4141 W 4875 S
- 4097 W 4750 S
- 4106 W 4875 S
- 5116 S 4300 W
- 5013 S 4150 W
- 4521 W 3950 S Unit 5
- 4512 W 3925 S Unit 20
- 4218 W 5050 S
- 4111 S 5350 W
- 4024 W 4650 S
- 4890 S 4075 W
- 3880 S 4550 W