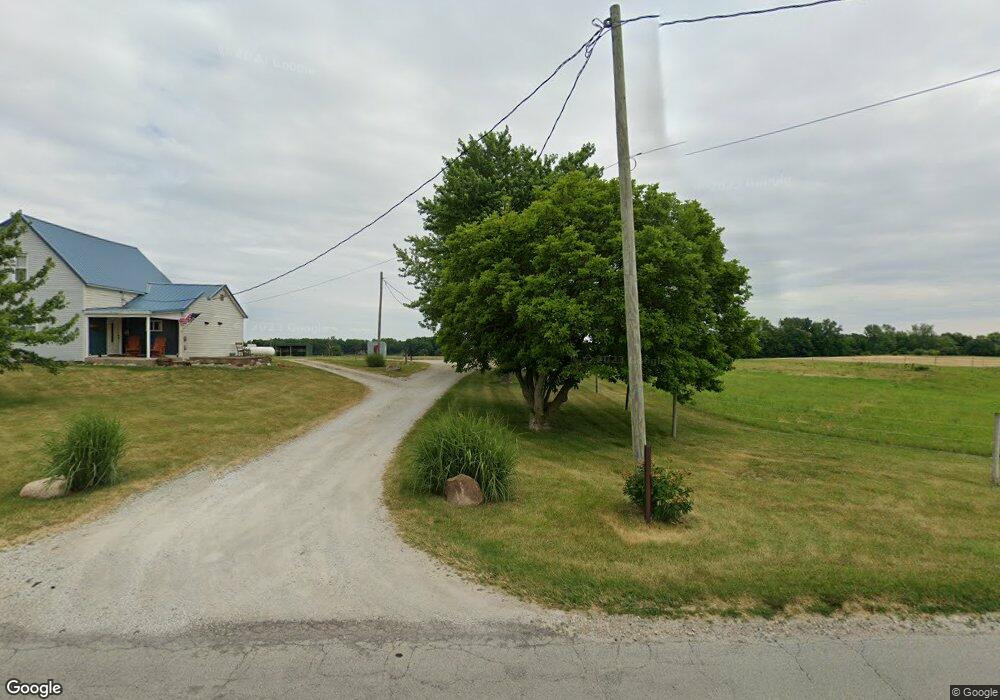
4810 W 700 S Claypool, IN 46510
Estimated Value: $178,000 - $207,021
3
Beds
1
Bath
1,404
Sq Ft
$138/Sq Ft
Est. Value
About This Home
This home is located at 4810 W 700 S, Claypool, IN 46510 and is currently estimated at $193,755, approximately $138 per square foot. 4810 W 700 S is a home located in Kosciusko County with nearby schools including Tippecanoe Valley High School.
Ownership History
Date
Name
Owned For
Owner Type
Purchase Details
Closed on
Dec 7, 2005
Sold by
Jpmorgan Chase Bank and Manhattan Chase
Bought by
Demske Mark A and Demske Lisa M
Current Estimated Value
Home Financials for this Owner
Home Financials are based on the most recent Mortgage that was taken out on this home.
Original Mortgage
$74,955
Interest Rate
6.34%
Mortgage Type
FHA
Purchase Details
Closed on
Oct 17, 2005
Sold by
Young Rex D
Bought by
Jpmorgan Chase Bank
Home Financials for this Owner
Home Financials are based on the most recent Mortgage that was taken out on this home.
Original Mortgage
$74,955
Interest Rate
6.34%
Mortgage Type
FHA
Purchase Details
Closed on
Oct 23, 2000
Sold by
Parker Stephen R
Bought by
Young Rex D and Young Sheila G
Purchase Details
Closed on
Sep 4, 1996
Sold by
Parker Stephen R
Bought by
Young Rex D and Young Sheila G
Purchase Details
Closed on
Jul 22, 1996
Sold by
Bruner Darrel E
Bought by
Parker Stephen R
Create a Home Valuation Report for This Property
The Home Valuation Report is an in-depth analysis detailing your home's value as well as a comparison with similar homes in the area
Home Values in the Area
Average Home Value in this Area
Purchase History
| Date | Buyer | Sale Price | Title Company |
|---|---|---|---|
| Demske Mark A | -- | Investors Title | |
| Jpmorgan Chase Bank | $70,376 | None Available | |
| Young Rex D | -- | -- | |
| Young Rex D | $64,917 | -- | |
| Parker Stephen R | $64,000 | -- |
Source: Public Records
Mortgage History
| Date | Status | Borrower | Loan Amount |
|---|---|---|---|
| Previous Owner | Demske Mark A | $74,955 |
Source: Public Records
Tax History Compared to Growth
Tax History
| Year | Tax Paid | Tax Assessment Tax Assessment Total Assessment is a certain percentage of the fair market value that is determined by local assessors to be the total taxable value of land and additions on the property. | Land | Improvement |
|---|---|---|---|---|
| 2024 | $679 | $129,000 | $28,000 | $101,000 |
| 2023 | $680 | $123,600 | $28,000 | $95,600 |
| 2022 | $658 | $117,700 | $28,000 | $89,700 |
| 2021 | $556 | $102,400 | $28,000 | $74,400 |
| 2020 | $569 | $99,400 | $28,000 | $71,400 |
| 2019 | $513 | $96,100 | $28,000 | $68,100 |
| 2018 | $483 | $93,200 | $28,000 | $65,200 |
| 2017 | $441 | $91,200 | $28,000 | $63,200 |
| 2016 | $419 | $89,200 | $27,000 | $62,200 |
| 2014 | $383 | $85,200 | $27,000 | $58,200 |
| 2013 | $383 | $85,200 | $27,000 | $58,200 |
Source: Public Records
Map
Nearby Homes
- 7180 S 425 W
- 5445 W Warren St
- 5439 W Warren St
- 5925 W 850 S
- 8727 S Hill Dr
- 102 S Main St
- 105 E Section St
- 204 S Graceland Ave
- 8920 S Merry Estates Dr
- 413 S Buffalo St
- 4280 S Scott Rd
- 4271 S Mallard Rd
- 1016 S Roosevelt St
- 4331 S 700 W
- 3650 S Shirey Dr
- 9716 S 750 W
- 9920 S Loon Ln
- 706 W Neher Rd
- 9451 S Amanda Dr
- 4239 S Kinsey Rd