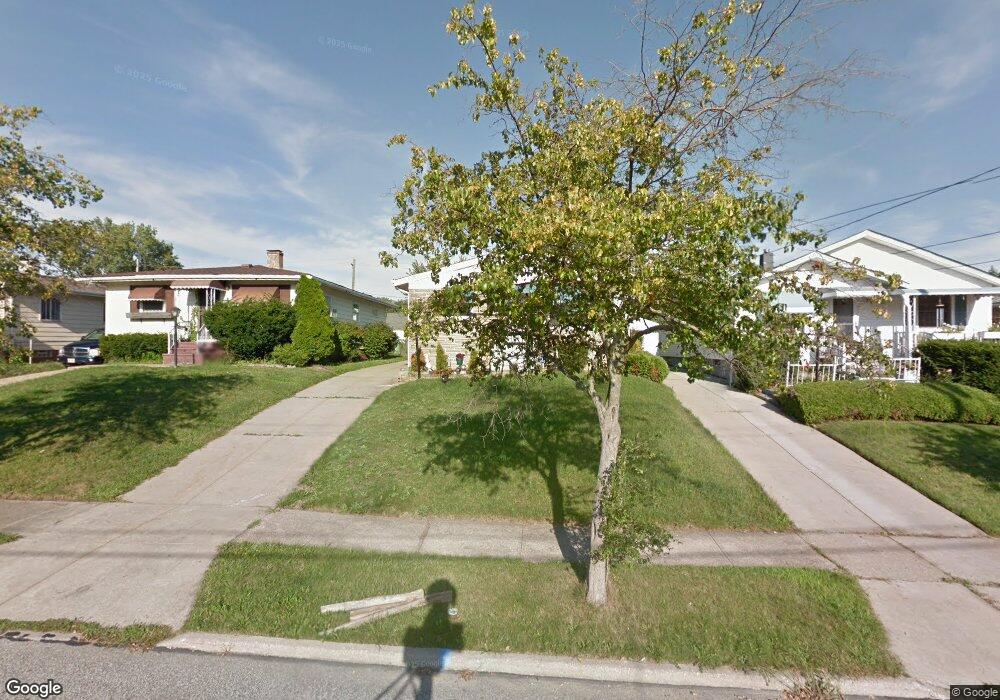
4811 E 176th St Cleveland, OH 44128
Lee-Miles NeighborhoodEstimated Value: $83,000 - $163,000
3
Beds
1
Bath
972
Sq Ft
$112/Sq Ft
Est. Value
About This Home
This home is located at 4811 E 176th St, Cleveland, OH 44128 and is currently estimated at $109,179, approximately $112 per square foot. 4811 E 176th St is a home located in Cuyahoga County with nearby schools including Citizens Academy Southeast, T2 Honors Academy, and Ramah Junior Academy.
Ownership History
Date
Name
Owned For
Owner Type
Purchase Details
Closed on
Mar 28, 2014
Sold by
Little Tamika
Bought by
Little Cassandra
Current Estimated Value
Purchase Details
Closed on
Mar 20, 2014
Sold by
Binarko Properties Llc Oh Series 159
Bought by
It Linton You Call It We Haul
Purchase Details
Closed on
Sep 15, 2013
Sold by
Aeon Financial Llc
Bought by
Binarko Properties Llc Oh Series 159
Purchase Details
Closed on
Mar 14, 2012
Sold by
Capitalsource Bank
Bought by
Aeon Financial Llc
Home Financials for this Owner
Home Financials are based on the most recent Mortgage that was taken out on this home.
Original Mortgage
$30,000,000
Interest Rate
4.08%
Mortgage Type
Future Advance Clause Open End Mortgage
Purchase Details
Closed on
Dec 21, 2011
Sold by
Tyree Wuaren E and Tyree Wuaren
Bought by
Capitalsource Bank
Home Financials for this Owner
Home Financials are based on the most recent Mortgage that was taken out on this home.
Original Mortgage
$17,000
Interest Rate
3.98%
Mortgage Type
Seller Take Back
Purchase Details
Closed on
Dec 2, 2011
Sold by
Capitalsource Bank
Bought by
It Linton You Call It We Haul
Home Financials for this Owner
Home Financials are based on the most recent Mortgage that was taken out on this home.
Original Mortgage
$17,000
Interest Rate
3.98%
Mortgage Type
Seller Take Back
Purchase Details
Closed on
Jun 15, 2009
Sold by
D N T Properties
Bought by
Tyree Wuaren and Tyree Dawn
Purchase Details
Closed on
Oct 25, 2007
Sold by
Tyree Wuaren E and Tyree Dawn N
Bought by
D N T Properties Llc
Purchase Details
Closed on
Jul 18, 2006
Sold by
National City Bank Indiana
Bought by
Tyree Wuaren E
Purchase Details
Closed on
Aug 4, 2005
Sold by
Simpson Kimberly M and Simpson Nathaniel C
Bought by
National City Bank Indiana
Purchase Details
Closed on
Mar 13, 2003
Sold by
Hill Kimberly M and Hill Kimberly
Bought by
Simpson Nathaniel C
Purchase Details
Closed on
Jun 6, 1997
Sold by
Thomas Shirley A
Bought by
Hill Kimberly M
Home Financials for this Owner
Home Financials are based on the most recent Mortgage that was taken out on this home.
Original Mortgage
$59,900
Interest Rate
8.17%
Mortgage Type
New Conventional
Purchase Details
Closed on
May 20, 1985
Sold by
Newell John
Bought by
Newell Shirley A
Purchase Details
Closed on
Mar 30, 1977
Sold by
Mcclintock Robt A and Mcclintock Patricia
Bought by
Newell John
Purchase Details
Closed on
Jan 1, 1975
Bought by
Mcclintock Robt A and Mcclintock Patricia
Create a Home Valuation Report for This Property
The Home Valuation Report is an in-depth analysis detailing your home's value as well as a comparison with similar homes in the area
Home Values in the Area
Average Home Value in this Area
Purchase History
| Date | Buyer | Sale Price | Title Company |
|---|---|---|---|
| Little Cassandra | -- | None Available | |
| Little Tamika | -- | None Available | |
| It Linton You Call It We Haul | $22,000 | None Available | |
| Binarko Properties Llc Oh Series 159 | $4,287 | Attorney | |
| Aeon Financial Llc | -- | Attorney | |
| Capitalsource Bank | $11,212 | None Available | |
| It Linton You Call It We Haul | $22,000 | None Available | |
| Tyree Wuaren | -- | None Available | |
| D N T Properties Llc | -- | Attorney | |
| Tyree Wuaren E | $56,000 | Accutitle | |
| National City Bank Indiana | $55,334 | Attorney | |
| Simpson Nathaniel C | -- | -- | |
| Hill Kimberly M | $60,000 | -- | |
| Newell Shirley A | -- | -- | |
| Newell John | $30,500 | -- | |
| Mcclintock Robt A | -- | -- |
Source: Public Records
Mortgage History
| Date | Status | Borrower | Loan Amount |
|---|---|---|---|
| Previous Owner | Aeon Financial Llc | $30,000,000 | |
| Previous Owner | It Linton You Call It We Haul | $17,000 | |
| Previous Owner | Hill Kimberly M | $59,900 |
Source: Public Records
Tax History Compared to Growth
Tax History
| Year | Tax Paid | Tax Assessment Tax Assessment Total Assessment is a certain percentage of the fair market value that is determined by local assessors to be the total taxable value of land and additions on the property. | Land | Improvement |
|---|---|---|---|---|
| 2024 | $888 | $23,345 | $5,565 | $17,780 |
| 2023 | $372 | $14,070 | $3,990 | $10,080 |
| 2022 | $401 | $14,070 | $3,990 | $10,080 |
| 2021 | $397 | $14,070 | $3,990 | $10,080 |
| 2020 | $360 | $12,920 | $3,680 | $9,240 |
| 2019 | $333 | $36,900 | $10,500 | $26,400 |
| 2018 | $1,147 | $12,920 | $3,680 | $9,240 |
| 2017 | $1,276 | $15,470 | $3,500 | $11,970 |
| 2016 | $1,266 | $15,470 | $3,500 | $11,970 |
| 2015 | $3,127 | $15,470 | $3,500 | $11,970 |
| 2014 | $3,127 | $17,020 | $3,890 | $13,130 |
Source: Public Records
Map
Nearby Homes
- 17806 Tarkington Ave
- 5031 Cato St
- 5046 Erwin St
- 16706 Myrtle Ave
- 16610 Priebe Ave
- 5082 Philip Ave
- 16702 Tarkington Ave
- 16817 Glenpark Ave
- 4899 Lee Rd
- 18704 Longview Ave
- 16408 Highview Dr
- 5150 Arch St
- 18851 Raymond St
- 17005 Lipton Ave
- 5177 Cato St
- 16307 Highview Dr
- 16216 Sunny Glenn Ave
- 5219 Joseph St
- 16351 Glenburn Ave
- 5185 Anthony St
- 4815 E 176th St
- 4807 E 176th St
- 4819 E 176th St
- 4803 E 176th St
- 4799 E 176th St
- 4823 E 176th St
- 4812 E 177th St
- 4808 E 177th St
- 4816 E 177th St
- 4827 E 176th St
- 4795 E 176th St
- 4804 E 177th St
- 4820 E 177th St
- 4800 E 177th St
- 4824 E 177th St
- 4812 E 176th St
- 4808 E 176th St
- 4816 E 176th St
- 4791 E 176th St
- 4831 E 176th St