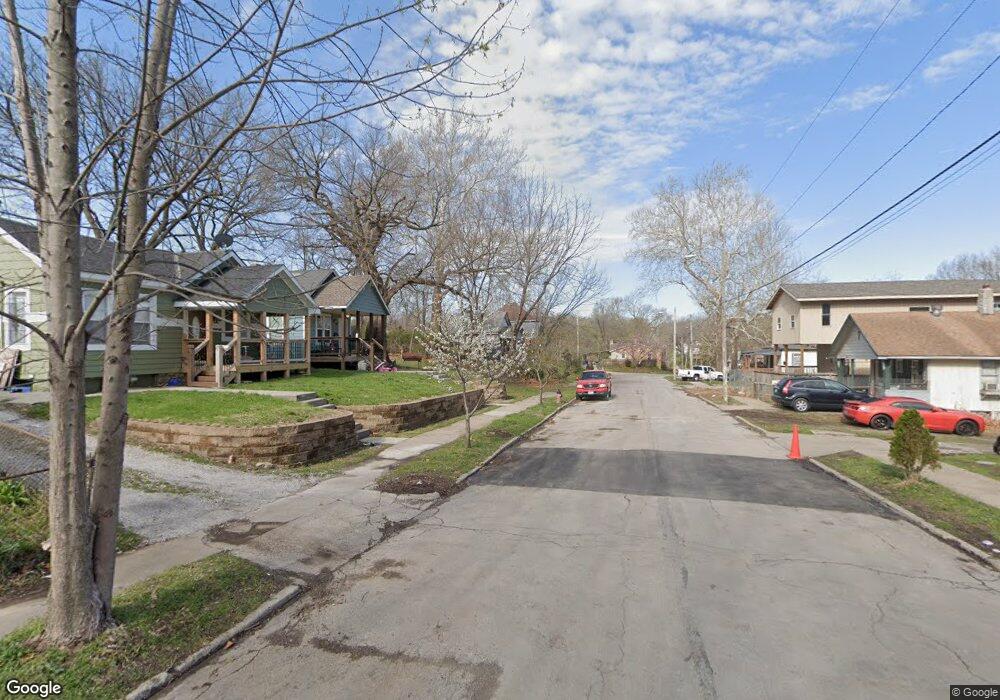
4811 E 18th St Kansas City, MO 64127
West Blue Valley NeighborhoodEstimated Value: $76,000 - $105,000
2
Beds
1
Bath
861
Sq Ft
$103/Sq Ft
Est. Value
About This Home
This home is located at 4811 E 18th St, Kansas City, MO 64127 and is currently estimated at $89,090, approximately $103 per square foot. 4811 E 18th St is a home located in Jackson County with nearby schools including Rogers Elementary School, Northeast Middle School, and East High School.
Ownership History
Date
Name
Owned For
Owner Type
Purchase Details
Closed on
Sep 25, 2023
Sold by
Jeannette Kenia
Bought by
Simon Daniel and Simon Jeannette Kenia
Current Estimated Value
Purchase Details
Closed on
Feb 23, 2023
Sold by
Simon Daniel
Bought by
Mejia Keniajeannette Hernandez
Purchase Details
Closed on
Aug 13, 2018
Sold by
Haw Carl O and Givhan Andrea L
Bought by
Simon Daniel
Purchase Details
Closed on
Aug 14, 2009
Sold by
Carmco Llc
Bought by
Shaw Carl O and Givhan Andrea L
Home Financials for this Owner
Home Financials are based on the most recent Mortgage that was taken out on this home.
Original Mortgage
$10,000
Interest Rate
5.2%
Mortgage Type
Seller Take Back
Purchase Details
Closed on
Feb 8, 2008
Sold by
Martinez Rosendo and Salas Michele L
Bought by
Carmco Llc
Purchase Details
Closed on
Apr 1, 1998
Sold by
Sauro Carmaline M Trust
Bought by
Carmco Llc
Create a Home Valuation Report for This Property
The Home Valuation Report is an in-depth analysis detailing your home's value as well as a comparison with similar homes in the area
Home Values in the Area
Average Home Value in this Area
Purchase History
| Date | Buyer | Sale Price | Title Company |
|---|---|---|---|
| Simon Daniel | -- | None Listed On Document | |
| Mejia Keniajeannette Hernandez | -- | -- | |
| Simon Daniel | -- | None Available | |
| Shaw Carl O | -- | None Available | |
| Carmco Llc | $31,237 | Commonwealth Land Title Insu | |
| Carmco Llc | -- | -- |
Source: Public Records
Mortgage History
| Date | Status | Borrower | Loan Amount |
|---|---|---|---|
| Previous Owner | Shaw Carl O | $10,000 |
Source: Public Records
Tax History Compared to Growth
Tax History
| Year | Tax Paid | Tax Assessment Tax Assessment Total Assessment is a certain percentage of the fair market value that is determined by local assessors to be the total taxable value of land and additions on the property. | Land | Improvement |
|---|---|---|---|---|
| 2025 | $571 | $4,272 | $2,704 | $1,568 |
| 2024 | $565 | $7,231 | $441 | $6,790 |
| 2023 | $565 | $7,231 | $623 | $6,608 |
| 2022 | $266 | $3,230 | $272 | $2,958 |
| 2021 | $265 | $3,230 | $272 | $2,958 |
| 2020 | $235 | $2,833 | $272 | $2,561 |
| 2019 | $230 | $2,833 | $272 | $2,561 |
| 2018 | $225 | $2,833 | $272 | $2,561 |
| 2017 | $225 | $2,833 | $272 | $2,561 |
| 2016 | $217 | $2,716 | $62 | $2,654 |
| 2014 | $218 | $2,716 | $62 | $2,654 |
Source: Public Records
Map
Nearby Homes
- 4819 E 17th St
- 4711 E 17th St
- 4902 E 17th St
- 1812 Elmwood Ave
- 1807 Kensington Ave
- 2023 Brighton Ave
- 2035 Brighton Ave
- 1711 Hardesty Ave
- 4900 E 23rd St
- 1603 Hardesty Ave
- 1413 Denver Ave
- 1323 Van Brunt Blvd
- 2243 Spruce Ave
- 2335 Chelsea Ave
- 1418 Hardesty Ave
- 1632 Topping Ave
- 2301 Drury Ave
- 5215 E 24th St
- 2406 Kensington Ave
- 2451 Chelsea Ave
- 4815 E 18th St
- 4809 E 18th St
- 4816 E 18th St
- 1809 Lister Ave
- 4821 E 18th St
- 1801 Lister Ave
- 4823 E 18th St
- 4822 E 18th St
- 4820 E 18th St
- 4827 E 18th St
- 4824 E 18th St
- 1817 Lister Ave
- 4828 E 18th St
- 4831 E 18th St
- 1804 Lister Ave
- 1808 Lister Ave
- 4835 E 18th St
- 1800 Lister Ave
- 1814 Lister Ave
- 4832 E 18th St