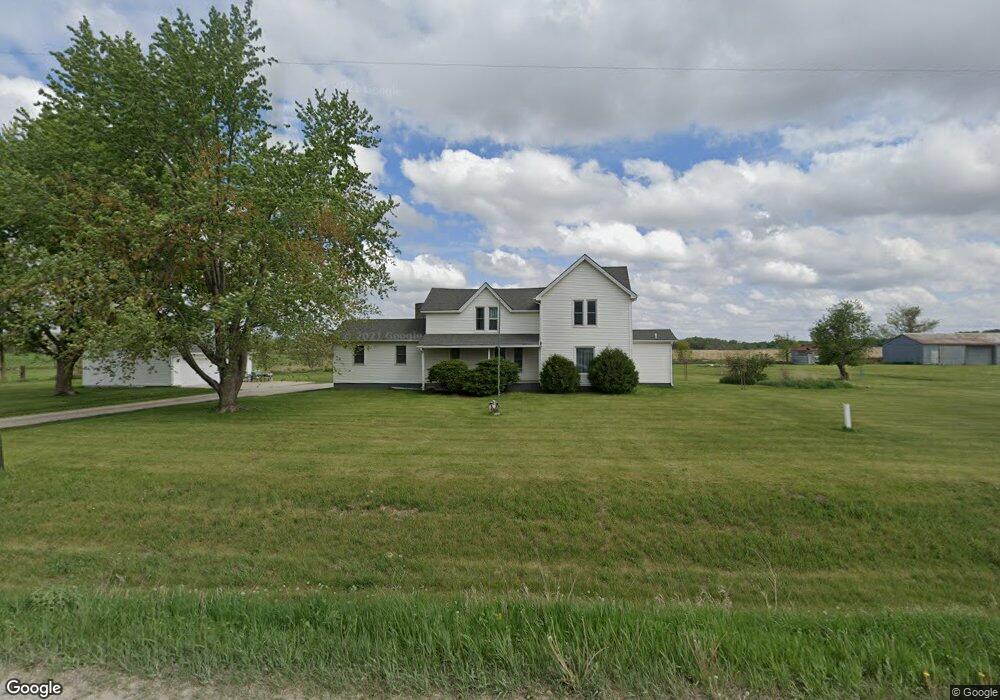
4811 Newell St Waterloo, IA 50703
Estimated Value: $305,121 - $346,000
4
Beds
2
Baths
2,225
Sq Ft
$146/Sq Ft
Est. Value
About This Home
This home is located at 4811 Newell St, Waterloo, IA 50703 and is currently estimated at $325,030, approximately $146 per square foot. 4811 Newell St is a home located in Black Hawk County with nearby schools including Poyner Elementary School, Bunger Middle School, and East High School.
Ownership History
Date
Name
Owned For
Owner Type
Purchase Details
Closed on
Dec 30, 2019
Sold by
Miller Douglas D and Miller Debra J
Bought by
Friedly Conner and Friedly Kathryn
Current Estimated Value
Home Financials for this Owner
Home Financials are based on the most recent Mortgage that was taken out on this home.
Original Mortgage
$208,896
Outstanding Balance
$184,532
Interest Rate
3.7%
Mortgage Type
VA
Estimated Equity
$140,498
Purchase Details
Closed on
Dec 27, 2019
Sold by
Miller Douglas D and Miller Debra J
Bought by
Friedly Conner and Friedly Kathryn
Home Financials for this Owner
Home Financials are based on the most recent Mortgage that was taken out on this home.
Original Mortgage
$208,896
Outstanding Balance
$184,532
Interest Rate
3.7%
Mortgage Type
VA
Estimated Equity
$140,498
Purchase Details
Closed on
Oct 26, 2017
Sold by
Miller Douglas D and Miller Debra J
Bought by
Oberhauser Clint and Oberhauser Michael
Create a Home Valuation Report for This Property
The Home Valuation Report is an in-depth analysis detailing your home's value as well as a comparison with similar homes in the area
Home Values in the Area
Average Home Value in this Area
Purchase History
| Date | Buyer | Sale Price | Title Company |
|---|---|---|---|
| Friedly Conner | $204,000 | Johnson Eric W | |
| Friedly Conner | $204,000 | None Available | |
| Oberhauser Clint | $500 | None Available |
Source: Public Records
Mortgage History
| Date | Status | Borrower | Loan Amount |
|---|---|---|---|
| Open | Friedly Conner | $208,896 | |
| Closed | Friedly Conner | $208,896 |
Source: Public Records
Tax History Compared to Growth
Tax History
| Year | Tax Paid | Tax Assessment Tax Assessment Total Assessment is a certain percentage of the fair market value that is determined by local assessors to be the total taxable value of land and additions on the property. | Land | Improvement |
|---|---|---|---|---|
| 2025 | $3,140 | $254,560 | $72,000 | $182,560 |
| 2024 | $3,140 | $242,900 | $60,000 | $182,900 |
| 2023 | $2,538 | $242,900 | $60,000 | $182,900 |
| 2022 | $2,498 | $186,670 | $48,000 | $138,670 |
| 2021 | $2,136 | $186,670 | $48,000 | $138,670 |
| 2020 | $2,142 | $147,290 | $39,000 | $108,290 |
| 2019 | $2,142 | $147,290 | $39,000 | $108,290 |
| 2018 | $2,200 | $147,290 | $39,000 | $108,290 |
Source: Public Records
Map
Nearby Homes
- TBD E Donald St
- 0 Newell St Unit NBR20241901
- 6418 Independence Ave Unit 6440
- 2836 Independence Ave
- 5955 Osage Rd
- LOT 40 Cloverdale
- 1733 Cottage Grove Ave
- 0 Maywood Ave
- 1337 Shultz St
- 000 Gray St
- 421 Miner Dr
- 0 Dubuque Rd Unit NBR20242713
- 000 Lafayette Rd
- 722 S View Dr
- 122 Ogden Ave
- 304 Saunders Ave
- 0 Plain View St
- 0 Plainview & Shirley St Unit NBR20254115
- Lot 5 Lafayette Rd
- Lot 1 Lafayette Rd