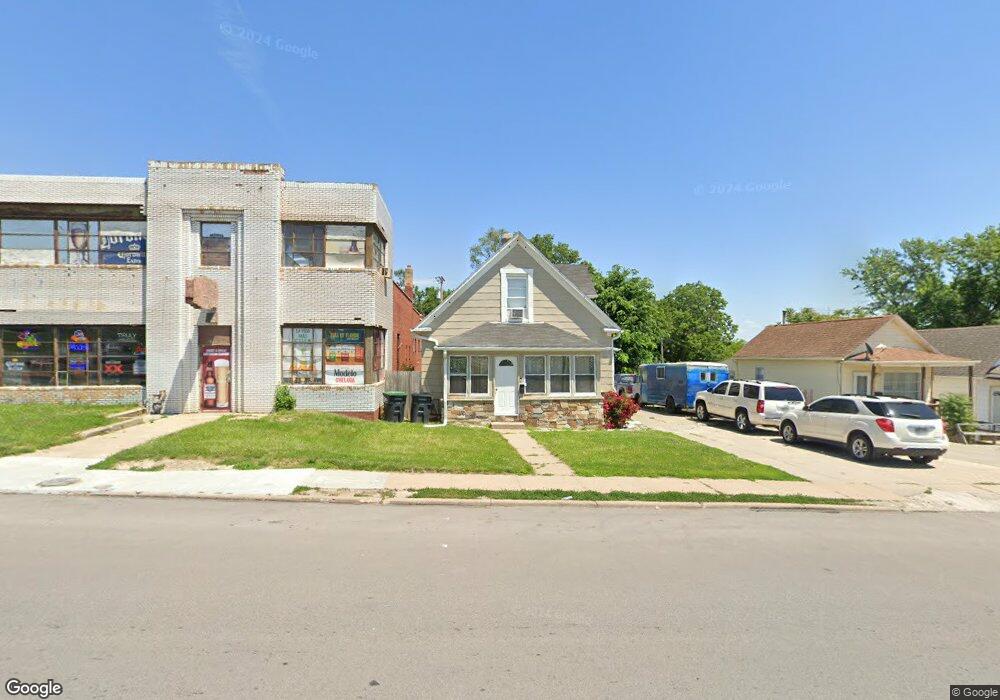
4811 S 20th St Omaha, NE 68107
Brown Park NeighborhoodEstimated Value: $183,000 - $216,705
5
Beds
2
Baths
1,690
Sq Ft
$117/Sq Ft
Est. Value
About This Home
This home is located at 4811 S 20th St, Omaha, NE 68107 and is currently estimated at $197,176, approximately $116 per square foot. 4811 S 20th St is a home located in Douglas County with nearby schools including Gomez Heritage Elementary School, R.M. Marrs Magnet Middle School, and South High School.
Ownership History
Date
Name
Owned For
Owner Type
Purchase Details
Closed on
Jun 7, 2022
Sold by
Riveros Gilberto J
Bought by
Echague Maria E and Silva Antonio
Current Estimated Value
Purchase Details
Closed on
Jul 5, 2017
Sold by
Flores Veronica Jimenez and Flores Juan Canales
Bought by
Riveros Echague Gilberto J
Home Financials for this Owner
Home Financials are based on the most recent Mortgage that was taken out on this home.
Original Mortgage
$53,441
Interest Rate
3.92%
Mortgage Type
New Conventional
Purchase Details
Closed on
Apr 9, 2013
Sold by
Guijarro Jose Sanchez
Bought by
Flores Veronica Jimenez and Flores Juan Canales
Create a Home Valuation Report for This Property
The Home Valuation Report is an in-depth analysis detailing your home's value as well as a comparison with similar homes in the area
Home Values in the Area
Average Home Value in this Area
Purchase History
| Date | Buyer | Sale Price | Title Company |
|---|---|---|---|
| Echague Maria E | -- | None Listed On Document | |
| Riveros Echague Gilberto J | $57,000 | None Available | |
| Flores Veronica Jimenez | $67,240 | None Available |
Source: Public Records
Mortgage History
| Date | Status | Borrower | Loan Amount |
|---|---|---|---|
| Previous Owner | Riveros Echague Gilberto J | $53,441 |
Source: Public Records
Tax History Compared to Growth
Tax History
| Year | Tax Paid | Tax Assessment Tax Assessment Total Assessment is a certain percentage of the fair market value that is determined by local assessors to be the total taxable value of land and additions on the property. | Land | Improvement |
|---|---|---|---|---|
| 2024 | $3,293 | $168,900 | $12,500 | $156,400 |
| 2023 | $3,293 | $156,100 | $12,500 | $143,600 |
| 2022 | $3,230 | $151,300 | $7,700 | $143,600 |
| 2021 | $2,703 | $127,700 | $7,700 | $120,000 |
| 2020 | $2,715 | $126,800 | $6,400 | $120,400 |
| 2019 | $2,216 | $103,200 | $6,400 | $96,800 |
| 2018 | $1,368 | $63,600 | $6,400 | $57,200 |
| 2017 | $1,365 | $63,600 | $6,400 | $57,200 |
| 2016 | $1,365 | $63,600 | $6,400 | $57,200 |
| 2015 | $1,346 | $63,600 | $6,400 | $57,200 |
| 2014 | $1,346 | $63,600 | $6,400 | $57,200 |
Source: Public Records
Map
Nearby Homes