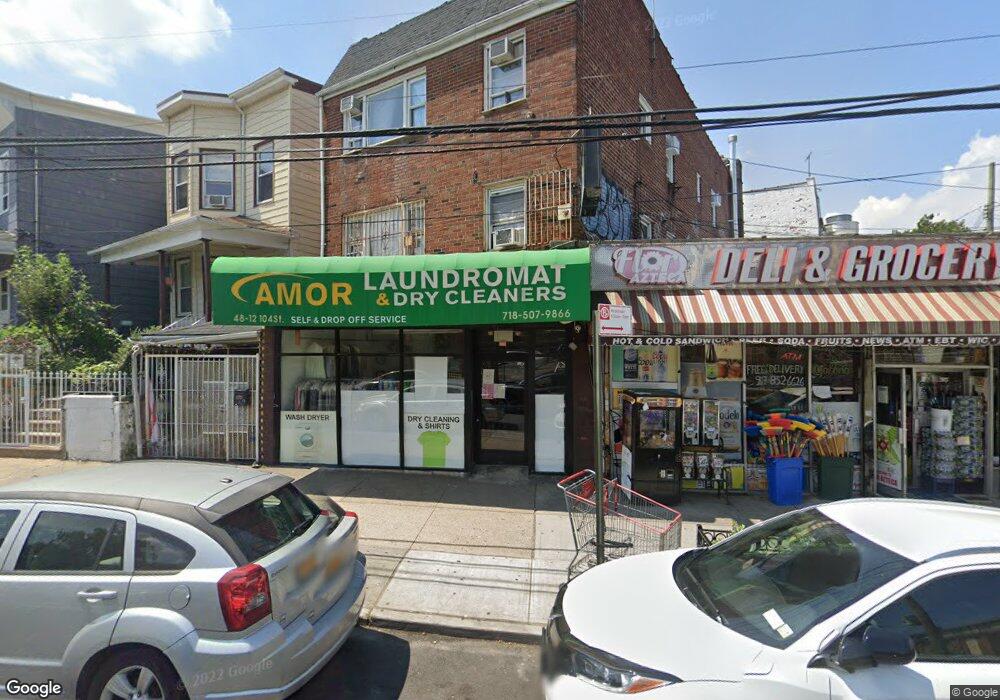
4812 104th St Flushing, NY 11368
Corona NeighborhoodEstimated Value: $2,089,207
Studio
--
Bath
5,139
Sq Ft
$407/Sq Ft
Est. Value
About This Home
This home is located at 4812 104th St, Flushing, NY 11368 and is currently estimated at $2,089,207, approximately $406 per square foot. 4812 104th St is a home located in Queens County with nearby schools including P.S. 110, Is 61 Leonardo Da Vinci, and John Bowne High School.
Ownership History
Date
Name
Owned For
Owner Type
Purchase Details
Closed on
Apr 23, 2012
Sold by
Bae Nak Jin and Bae Pill Soon
Bought by
Hcy Realty Associates Llc
Current Estimated Value
Home Financials for this Owner
Home Financials are based on the most recent Mortgage that was taken out on this home.
Original Mortgage
$103,352
Outstanding Balance
$71,956
Interest Rate
4.08%
Mortgage Type
Commercial
Estimated Equity
$2,017,251
Purchase Details
Closed on
Mar 21, 2002
Sold by
Garcia Nelson and Garcia Nelson
Bought by
Lee Myong S
Home Financials for this Owner
Home Financials are based on the most recent Mortgage that was taken out on this home.
Original Mortgage
$340,000
Interest Rate
7.13%
Mortgage Type
Commercial
Purchase Details
Closed on
Mar 1, 2000
Sold by
Dinardo Antonio and Dinardo Pam
Bought by
Garcia Nelson and Garcia Nelson
Home Financials for this Owner
Home Financials are based on the most recent Mortgage that was taken out on this home.
Original Mortgage
$199,000
Interest Rate
8.24%
Mortgage Type
Seller Take Back
Create a Home Valuation Report for This Property
The Home Valuation Report is an in-depth analysis detailing your home's value as well as a comparison with similar homes in the area
Home Values in the Area
Average Home Value in this Area
Purchase History
| Date | Buyer | Sale Price | Title Company |
|---|---|---|---|
| Hcy Realty Associates Llc | $1,130,000 | -- | |
| Lee Myong S | -- | -- | |
| Garcia Nelson | $336,500 | -- |
Source: Public Records
Mortgage History
| Date | Status | Borrower | Loan Amount |
|---|---|---|---|
| Open | Hcy Realty Associates Llc | $103,352 | |
| Previous Owner | Lee Myong S | $340,000 | |
| Previous Owner | Garcia Nelson | $199,000 |
Source: Public Records
Tax History
| Year | Tax Paid | Tax Assessment Tax Assessment Total Assessment is a certain percentage of the fair market value that is determined by local assessors to be the total taxable value of land and additions on the property. | Land | Improvement |
|---|---|---|---|---|
| 2025 | $32,412 | $297,180 | $78,750 | $218,430 |
| 2024 | $32,412 | $306,000 | $78,750 | $227,250 |
| 2023 | $32,030 | $302,400 | $76,500 | $225,900 |
| 2022 | $15,995 | $297,450 | $78,750 | $218,700 |
| 2021 | $27,911 | $261,000 | $78,750 | $182,250 |
| 2020 | $35,686 | $370,350 | $78,750 | $291,600 |
| 2019 | $33,535 | $358,200 | $67,500 | $290,700 |
| 2018 | $31,709 | $301,588 | $67,500 | $234,088 |
| 2017 | $29,476 | $280,348 | $67,500 | $212,848 |
| 2016 | $28,255 | $280,348 | $67,500 | $212,848 |
| 2015 | $17,851 | $255,598 | $67,500 | $188,098 |
| 2014 | $17,851 | $273,058 | $67,500 | $205,558 |
Source: Public Records
Map
Nearby Homes
- 10311 Corona Ave
- 10309 Corona Ave
- 10307 Corona Ave
- 103-07 Corona Ave
- 102-48 Nicolls Ave
- 103-16 Corona Ave Unit 2D
- 104-04 47th Ave Unit 2C
- 103-25 Alstyne Ave
- 104-20 47th Ave
- 104-49 49th Ave
- 10311-09-07 Corona Ave
- 10603 49th Ave
- 10605 49th Ave
- 10237 Nicolls Ave
- 103-26 Alstyne Ave
- 10444 47th Ave
- 49-18 103rd St
- 107-47 49th Ave
- 106-16 Corona Ave
- 45-09 104th St
- 48-12 104th St
- 4816 104th St
- 4820 104th St
- 48-11 104th St
- 10262 Nicolls Ave
- 102-62 Nicolls Ave
- 10260 Nicolls Ave
- 4824 104th St
- 10258 Nicolls Ave
- 10317 Corona Ave
- 10206 Corona Ave
- 103-09 Corona Ave
- 10254 Nicolls Ave
- 4726 104th St
- 47-26 104th St
- 10405 49th Ave
- 4832 104th St
- 103-03 Corona Ave Unit 1fl
- 103-03 Corona Ave Unit 3Fl
- 10303 Corona Ave
Your Personal Tour Guide
Ask me questions while you tour the home.