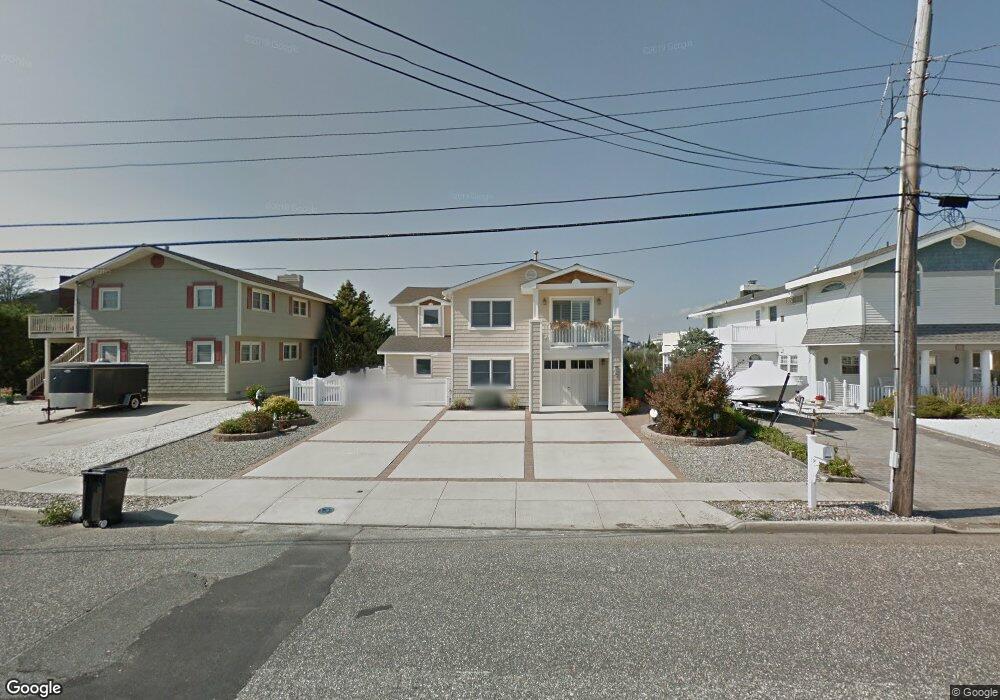
4812 4th Ave Avalon, NJ 08202
Estimated Value: $4,022,000 - $5,574,963
--
Bed
--
Bath
2,735
Sq Ft
$1,843/Sq Ft
Est. Value
About This Home
This home is located at 4812 4th Ave, Avalon, NJ 08202 and is currently estimated at $5,040,321, approximately $1,842 per square foot. 4812 4th Ave is a home located in Cape May County with nearby schools including Avalon Elementary School.
Ownership History
Date
Name
Owned For
Owner Type
Purchase Details
Closed on
Jan 8, 1999
Sold by
Bridge Terry
Bought by
Gentile Michele and Gentile Gregory
Current Estimated Value
Home Financials for this Owner
Home Financials are based on the most recent Mortgage that was taken out on this home.
Original Mortgage
$360,000
Outstanding Balance
$82,853
Interest Rate
6.67%
Estimated Equity
$4,957,468
Purchase Details
Closed on
Sep 28, 1992
Sold by
Bridge Jr E W
Bought by
Bridge Terry A and Bridge Edward H
Purchase Details
Closed on
Sep 4, 1991
Sold by
New Jersey Dept
Bought by
Bridge Edward W and Bridge Marie S
Create a Home Valuation Report for This Property
The Home Valuation Report is an in-depth analysis detailing your home's value as well as a comparison with similar homes in the area
Home Values in the Area
Average Home Value in this Area
Purchase History
| Date | Buyer | Sale Price | Title Company |
|---|---|---|---|
| Gentile Michele | $575,000 | -- | |
| Bridge Terry A | -- | -- | |
| Bridge E W | -- | -- | |
| Bridge Edward W | $3,000 | -- |
Source: Public Records
Mortgage History
| Date | Status | Borrower | Loan Amount |
|---|---|---|---|
| Open | Gentile Michele | $360,000 |
Source: Public Records
Tax History Compared to Growth
Tax History
| Year | Tax Paid | Tax Assessment Tax Assessment Total Assessment is a certain percentage of the fair market value that is determined by local assessors to be the total taxable value of land and additions on the property. | Land | Improvement |
|---|---|---|---|---|
| 2025 | $13,994 | $2,279,200 | $1,700,000 | $579,200 |
| 2024 | $13,994 | $2,279,200 | $1,700,000 | $579,200 |
| 2023 | $13,880 | $2,279,200 | $1,700,000 | $579,200 |
| 2022 | $12,946 | $2,279,200 | $1,700,000 | $579,200 |
| 2021 | $12,467 | $2,279,200 | $1,700,000 | $579,200 |
| 2020 | $11,989 | $2,279,200 | $1,700,000 | $579,200 |
| 2019 | $11,624 | $2,279,200 | $1,700,000 | $579,200 |
| 2018 | $11,123 | $2,279,200 | $1,700,000 | $579,200 |
| 2017 | $11,813 | $2,124,600 | $1,600,000 | $524,600 |
| 2016 | $11,685 | $2,124,600 | $1,600,000 | $524,600 |
| 2015 | $11,494 | $2,124,600 | $1,600,000 | $524,600 |
| 2014 | $11,367 | $2,124,600 | $1,600,000 | $524,600 |
Source: Public Records
Map
Nearby Homes
- 4640 Ocean Dr
- 4610 4th Ave
- 5499 Dune Dr
- 264 41st St
- 245 57th St
- 5765 Ocean Dr
- 22 Pelican Dr S
- 74 38th St
- 6229 Dune Dr
- 253 35th St Unit WEST
- 3429 Dune Dr
- 150 64th St
- 162 33rd St
- 173 33rd St Unit 3
- 158 32nd St
- 179 32nd St
- 3149 First Ave
- 55 32nd St W Unit C2B
- 6762 Ocean Dr Unit 6762
- 6772 Ocean Dr Unit 6772