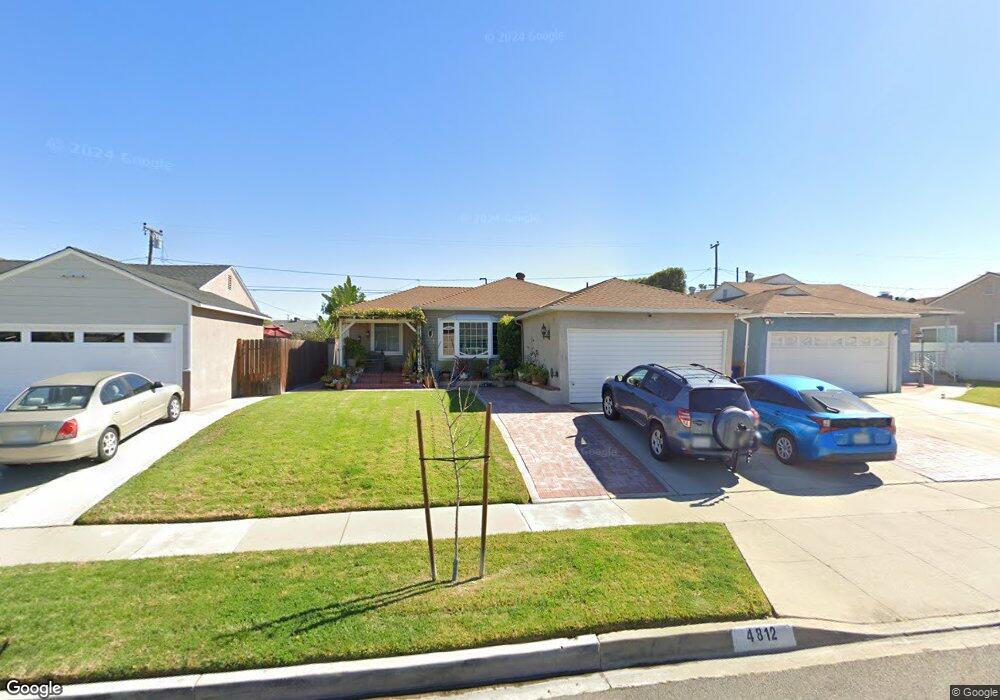
4812 Castana Ave Lakewood, CA 90712
Lakewood Mutual NeighborhoodEstimated Value: $766,000 - $924,000
2
Beds
1
Bath
966
Sq Ft
$847/Sq Ft
Est. Value
About This Home
This home is located at 4812 Castana Ave, Lakewood, CA 90712 and is currently estimated at $818,399, approximately $847 per square foot. 4812 Castana Ave is a home located in Los Angeles County with nearby schools including Riley Elementary School, Hoover Middle School, and Lakewood High School.
Ownership History
Date
Name
Owned For
Owner Type
Purchase Details
Closed on
Sep 2, 2016
Sold by
Allum Edward Lawrence
Bought by
Allum Edward Lawrence
Current Estimated Value
Home Financials for this Owner
Home Financials are based on the most recent Mortgage that was taken out on this home.
Original Mortgage
$314,000
Outstanding Balance
$199,131
Interest Rate
3.48%
Mortgage Type
New Conventional
Estimated Equity
$619,268
Purchase Details
Closed on
Jan 7, 1997
Sold by
Trust Lodge Mona H Tr Mona H Lodge Famil
Bought by
Allum Edward L
Home Financials for this Owner
Home Financials are based on the most recent Mortgage that was taken out on this home.
Original Mortgage
$139,366
Interest Rate
7.58%
Mortgage Type
FHA
Purchase Details
Closed on
Jul 11, 1994
Sold by
Lodge Mona H
Bought by
Mona Lodge Family Trust
Create a Home Valuation Report for This Property
The Home Valuation Report is an in-depth analysis detailing your home's value as well as a comparison with similar homes in the area
Home Values in the Area
Average Home Value in this Area
Purchase History
| Date | Buyer | Sale Price | Title Company |
|---|---|---|---|
| Allum Edward Lawrence | -- | North American Title Co Inc | |
| Allum Edward L | $141,500 | Commonwealth Title | |
| Mona Lodge Family Trust | -- | -- |
Source: Public Records
Mortgage History
| Date | Status | Borrower | Loan Amount |
|---|---|---|---|
| Open | Allum Edward Lawrence | $314,000 | |
| Closed | Allum Edward L | $139,366 |
Source: Public Records
Tax History Compared to Growth
Tax History
| Year | Tax Paid | Tax Assessment Tax Assessment Total Assessment is a certain percentage of the fair market value that is determined by local assessors to be the total taxable value of land and additions on the property. | Land | Improvement |
|---|---|---|---|---|
| 2025 | $3,284 | $230,428 | $171,160 | $59,268 |
| 2024 | $3,284 | $225,910 | $167,804 | $58,106 |
| 2023 | $3,227 | $221,481 | $164,514 | $56,967 |
| 2022 | $3,040 | $217,139 | $161,289 | $55,850 |
| 2021 | $2,975 | $212,882 | $158,127 | $54,755 |
| 2019 | $2,930 | $206,570 | $153,438 | $53,132 |
| 2018 | $2,799 | $202,521 | $150,430 | $52,091 |
| 2016 | $2,579 | $194,659 | $144,590 | $50,069 |
| 2015 | $2,484 | $191,736 | $142,419 | $49,317 |
| 2014 | $2,471 | $187,981 | $139,630 | $48,351 |
Source: Public Records
Map
Nearby Homes
- 4848 Oliva Ave
- 3638 Sandwood St
- 4740 Pepperwood Ave
- 4944 Coke Ave
- 4532 Pepperwood Ave
- 4520 Pepperwood Ave
- 4808 Graywood Ave
- 4851 Faculty Ave
- 4826 Faculty Ave
- 4121 Country Club Dr
- 3244 Centralia St
- 4704 E Centralia St
- 2912 Allred St
- 2922 Eckleson St
- 4559 Levelside Ave
- 2912 Yearling St
- 4839 Premiere Ave
- 2803 Frankel St
- 2729 Greentop St
- 2739 Denmead St
- 4818 Castana Ave
- 4806 Castana Ave
- 4822 Castana Ave
- 4802 Castana Ave
- 4813 Oliva Ave
- 4819 Oliva Ave
- 4809 Oliva Ave
- 4803 Oliva Ave
- 4823 Oliva Ave
- 4826 Castana Ave
- 4760 Castana Ave
- 4813 Castana Ave
- 4809 Castana Ave
- 4817 Castana Ave
- 4829 Oliva Ave
- 4759 Oliva Ave
- 4803 Castana Ave
- 4823 Castana Ave
- 4832 Castana Ave
- 4754 Castana Ave