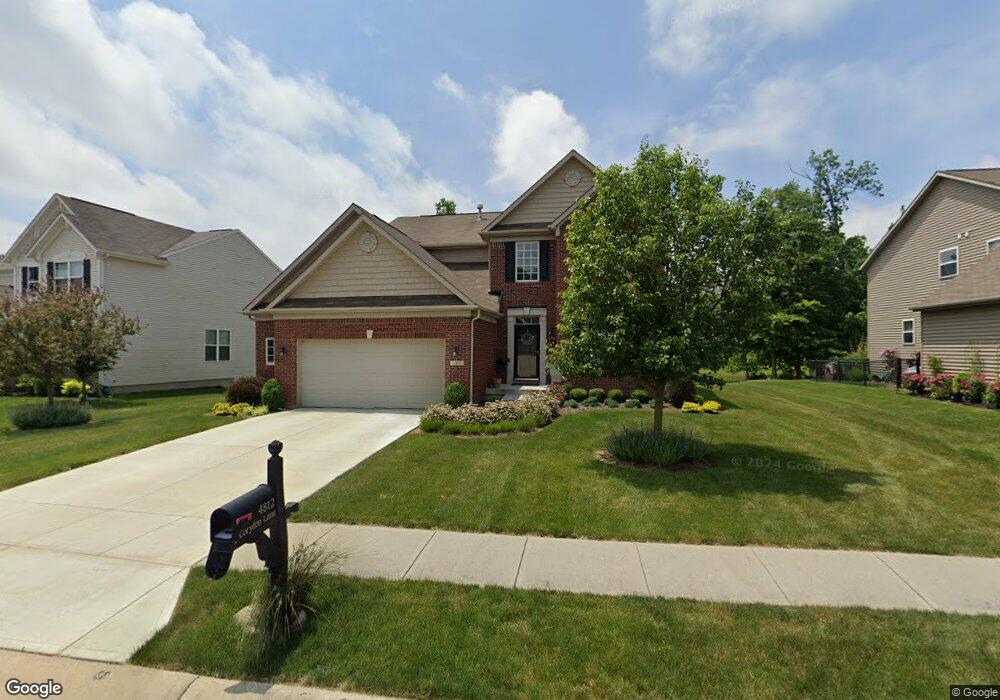
4812 Corydon Ln Indianapolis, IN 46239
New Bethel NeighborhoodEstimated Value: $397,000 - $528,000
5
Beds
3
Baths
3,036
Sq Ft
$144/Sq Ft
Est. Value
About This Home
This home is located at 4812 Corydon Ln, Indianapolis, IN 46239 and is currently estimated at $437,664, approximately $144 per square foot. 4812 Corydon Ln is a home located in Marion County with nearby schools including Franklin Central High School and Nativity Catholic School.
Ownership History
Date
Name
Owned For
Owner Type
Purchase Details
Closed on
Jun 27, 2011
Sold by
Saneholtz Michael A and Saneholtz Sarah Hodge
Bought by
Ray Alexander W and Ray Qianshan
Current Estimated Value
Home Financials for this Owner
Home Financials are based on the most recent Mortgage that was taken out on this home.
Original Mortgage
$288,000
Outstanding Balance
$196,794
Interest Rate
4.52%
Mortgage Type
New Conventional
Estimated Equity
$240,870
Purchase Details
Closed on
Jun 28, 2007
Sold by
Saneholtz Michael A
Bought by
Sancholtz Michael A and Sancholtz Sarah Hodge
Home Financials for this Owner
Home Financials are based on the most recent Mortgage that was taken out on this home.
Original Mortgage
$203,960
Interest Rate
5.87%
Mortgage Type
Adjustable Rate Mortgage/ARM
Purchase Details
Closed on
Sep 11, 2006
Sold by
Bay Communities Llc
Bought by
Rh Of Indiana Lp
Create a Home Valuation Report for This Property
The Home Valuation Report is an in-depth analysis detailing your home's value as well as a comparison with similar homes in the area
Home Values in the Area
Average Home Value in this Area
Purchase History
| Date | Buyer | Sale Price | Title Company |
|---|---|---|---|
| Ray Alexander W | -- | Chicago Title | |
| Sancholtz Michael A | -- | None Available | |
| Saneholtz Michael A | -- | None Available | |
| Rh Of Indiana Lp | -- | None Available |
Source: Public Records
Mortgage History
| Date | Status | Borrower | Loan Amount |
|---|---|---|---|
| Open | Ray Alexander W | $288,000 | |
| Previous Owner | Saneholtz Michael A | $203,960 |
Source: Public Records
Tax History Compared to Growth
Tax History
| Year | Tax Paid | Tax Assessment Tax Assessment Total Assessment is a certain percentage of the fair market value that is determined by local assessors to be the total taxable value of land and additions on the property. | Land | Improvement |
|---|---|---|---|---|
| 2024 | $3,249 | $354,100 | $48,100 | $306,000 |
| 2023 | $3,249 | $314,300 | $48,100 | $266,200 |
| 2022 | $3,279 | $314,300 | $48,100 | $266,200 |
| 2021 | $3,074 | $297,200 | $48,100 | $249,100 |
| 2020 | $2,913 | $281,400 | $48,100 | $233,300 |
| 2019 | $2,775 | $267,800 | $41,300 | $226,500 |
| 2018 | $2,607 | $251,300 | $41,300 | $210,000 |
| 2017 | $2,597 | $250,500 | $41,300 | $209,200 |
| 2016 | $2,407 | $231,700 | $41,300 | $190,400 |
| 2014 | $2,314 | $231,400 | $41,300 | $190,100 |
| 2013 | $2,101 | $210,100 | $41,300 | $168,800 |
Source: Public Records
Map
Nearby Homes
- 4754 Corydon Ln
- 4562 Blacktail Dr
- 4552 Blacktail Dr
- 4708 Kintz Dr
- 10534 Pokagon Way
- 4810 Potato Creek Rd
- 4539 Maldenhair Dr
- 4501 Goose Rock Dr
- 4620 Kintz Dr
- 4444 Goose Rock Dr
- 4747 Summit Lake Place
- 10723 Pokagon Way
- 10407 Deercrest Ln
- 10522 Hunters Crossing Blvd
- 5228 Dragon Tree Ln
- 10451 Pintail Ln
- 10455 Pintail Ln
- 10509 Oak Bend Blvd
- 9700 E Thompson Rd
- 10638 Oak Bend Blvd
- 4820 Corydon Ln
- 4804 Corydon Ln
- 4828 Corydon Ln
- 4762 Corydon Ln
- 4817 Shakamak Ct
- 4813 Corydon Ln
- 4805 Corydon Ln
- 4821 Corydon Ln
- 4836 Corydon Ln
- 4820 Shakamak Ct
- 10320 Corydon Ct
- 4755 Corydon Ln
- 4844 Corydon Ln
- 4746 Corydon Ln
- 4735 Corydon Ln
- 10328 Corydon Ct
- 4772 Clifty Falls Ct
- 4764 Clifty Falls Ct
- 4835 Shakamak Ct
- 4841 Corydon Ln