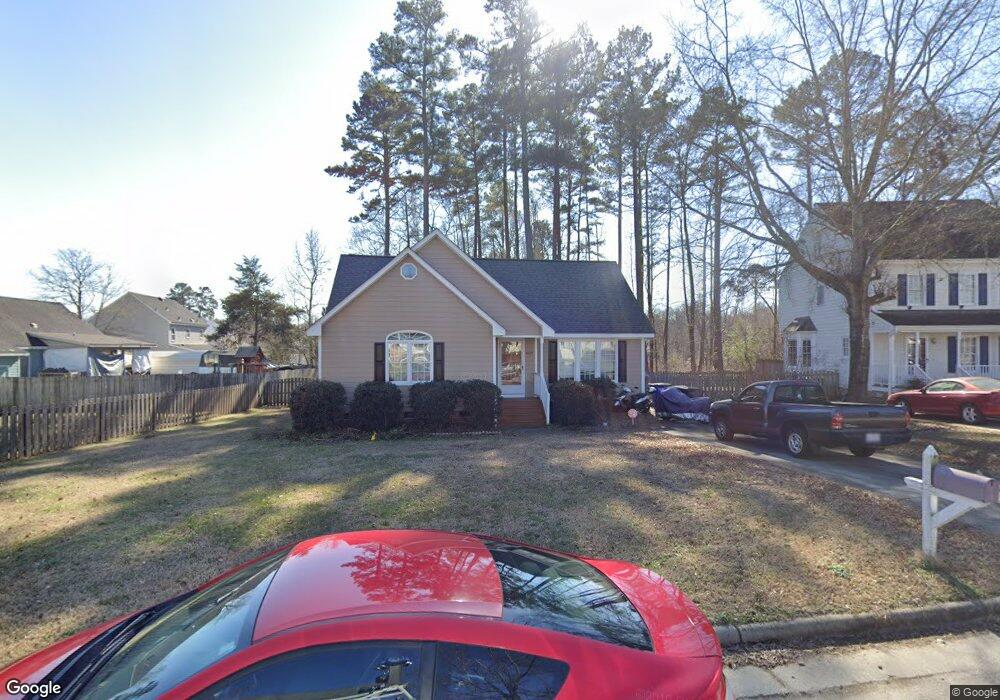
4812 Mimetree Ct Raleigh, NC 27616
Forestville NeighborhoodEstimated Value: $292,000 - $325,000
4
Beds
3
Baths
1,609
Sq Ft
$195/Sq Ft
Est. Value
About This Home
This home is located at 4812 Mimetree Ct, Raleigh, NC 27616 and is currently estimated at $313,833, approximately $195 per square foot. 4812 Mimetree Ct is a home located in Wake County with nearby schools including Fox Road Elementary School, Wake Forest-Rolesville Middle School, and Wakefield High School.
Ownership History
Date
Name
Owned For
Owner Type
Purchase Details
Closed on
Apr 16, 2013
Sold by
Secretary Of Veterans Affairs
Bought by
Andux Alan Michael and Andux Albert Jerome
Current Estimated Value
Purchase Details
Closed on
Jan 23, 2013
Sold by
Gonzalez Larry and Gonzalez Daisy Benitez
Bought by
Secretary Of Veterans Affairs
Purchase Details
Closed on
Dec 14, 2007
Sold by
Jones Earl J and Jones Gracie R
Bought by
Gonzalez Larry and Benitez Gonzalez Daisy
Home Financials for this Owner
Home Financials are based on the most recent Mortgage that was taken out on this home.
Original Mortgage
$155,778
Interest Rate
6.22%
Mortgage Type
VA
Purchase Details
Closed on
Feb 4, 1999
Sold by
Pinckney Harold J and Pinckney Virgestine W
Bought by
Jones Earl J and Jones Gracie R
Home Financials for this Owner
Home Financials are based on the most recent Mortgage that was taken out on this home.
Original Mortgage
$128,408
Interest Rate
6.8%
Mortgage Type
FHA
Create a Home Valuation Report for This Property
The Home Valuation Report is an in-depth analysis detailing your home's value as well as a comparison with similar homes in the area
Home Values in the Area
Average Home Value in this Area
Purchase History
| Date | Buyer | Sale Price | Title Company |
|---|---|---|---|
| Andux Alan Michael | -- | None Available | |
| Secretary Of Veterans Affairs | $104,874 | None Available | |
| Gonzalez Larry | $152,500 | None Available | |
| Jones Earl J | $130,000 | -- |
Source: Public Records
Mortgage History
| Date | Status | Borrower | Loan Amount |
|---|---|---|---|
| Previous Owner | Gonzalez Larry | $155,778 | |
| Previous Owner | Jones Earl J | $128,408 |
Source: Public Records
Tax History
| Year | Tax Paid | Tax Assessment Tax Assessment Total Assessment is a certain percentage of the fair market value that is determined by local assessors to be the total taxable value of land and additions on the property. | Land | Improvement |
|---|---|---|---|---|
| 2025 | $2,811 | $320,026 | $95,000 | $225,026 |
| 2024 | $2,799 | $320,026 | $95,000 | $225,026 |
Source: Public Records
Map
Nearby Homes
- 7209 Ewing Place
- 7232 Ewing Place
- 4610 Jacqueline Ln
- 4700 Draper Rd
- 7313 Jacqueline Ln
- 7329 Bassett Hall Ct
- 8225 Merriweather Cir
- 8253 Merriweather Cir
- 5104 Dice Dr
- 7205 Beaverwood Dr
- 6900 Glenroy Ct
- 8332 Mcguire Dr
- 8031 Perry Creek Rd
- 8029 Perry Creek Rd
- 7224 Beaverwood Dr
- 5345 Glen Canyon Rd
- 8372 Mcguire Dr
- 7309 Beaverwood Dr
- 7408 Fox Rd
- 5262 Little Sandy Dr
- 4808 Mimetree Ct
- 4417 Wolftrap Rd
- 4413 Wolftrap Rd
- 4409 Wolftrap Rd
- 4813 Mimetree Ct
- 4809 Mimetree Ct
- 4804 Mimetree Ct
- 4817 Mimetree Ct
- 4821 Mimetree Ct
- 4405 Wolftrap Rd
- 4800 Mimetree Ct
- 4805 Mimetree Ct
- 4408 Wolftrap Rd
- 4808 Hallam Way
- 4412 Wolftrap Rd
- 4404 Wolftrap Rd
- 4401 Wolftrap Rd
- 4416 Wolftrap Rd
- 4812 Hallam Way
- 4313 Pillory Place
Your Personal Tour Guide
Ask me questions while you tour the home.