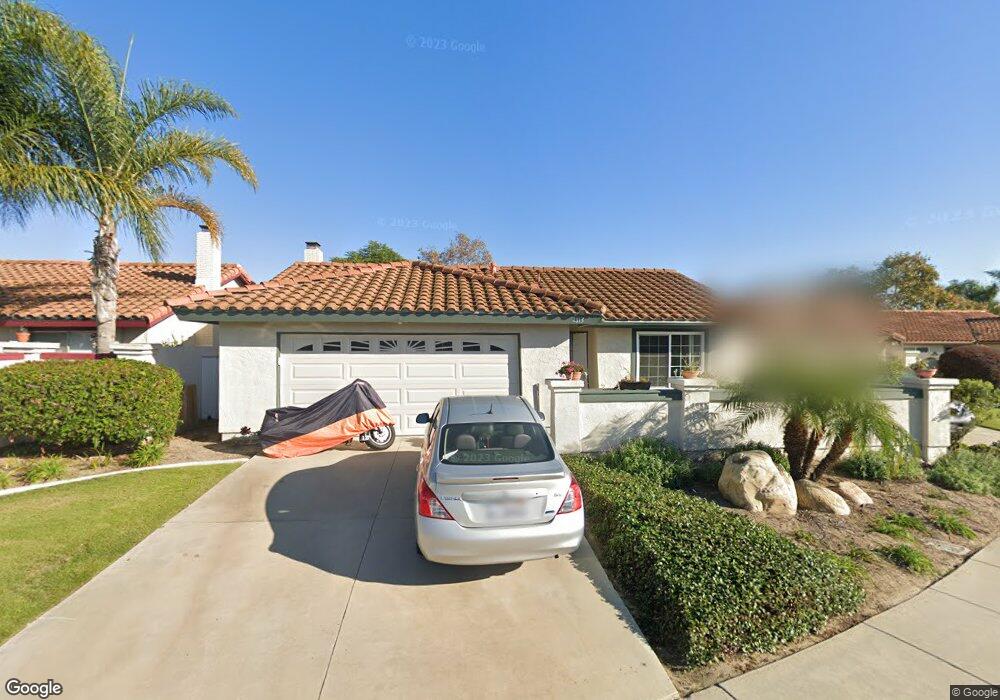
4813 Ceanothus Place Oceanside, CA 92057
San Luis Rey NeighborhoodEstimated Value: $757,000 - $790,000
4
Beds
2
Baths
1,411
Sq Ft
$547/Sq Ft
Est. Value
About This Home
This home is located at 4813 Ceanothus Place, Oceanside, CA 92057 and is currently estimated at $771,516, approximately $546 per square foot. 4813 Ceanothus Place is a home located in San Diego County with nearby schools including Del Rio Elementary School, Cesar Chavez Middle School, and El Camino High School.
Ownership History
Date
Name
Owned For
Owner Type
Purchase Details
Closed on
Jan 28, 2010
Sold by
Nurse Cella B
Bought by
Nurse Cella B
Current Estimated Value
Purchase Details
Closed on
Mar 12, 2003
Sold by
Nurse Oswald F
Bought by
Nurse Cella B
Home Financials for this Owner
Home Financials are based on the most recent Mortgage that was taken out on this home.
Original Mortgage
$148,500
Outstanding Balance
$61,146
Interest Rate
5.79%
Estimated Equity
$710,370
Purchase Details
Closed on
Feb 7, 1995
Sold by
Va
Bought by
Nurse Oswald F and Nurse Cella B
Home Financials for this Owner
Home Financials are based on the most recent Mortgage that was taken out on this home.
Original Mortgage
$129,700
Interest Rate
9.03%
Mortgage Type
VA
Purchase Details
Closed on
Oct 18, 1994
Sold by
Choothesa Amatchai and Choothesa Concepcion
Bought by
Barclaysamerican Mtg Corp
Purchase Details
Closed on
Apr 20, 1990
Purchase Details
Closed on
Nov 14, 1985
Create a Home Valuation Report for This Property
The Home Valuation Report is an in-depth analysis detailing your home's value as well as a comparison with similar homes in the area
Home Values in the Area
Average Home Value in this Area
Purchase History
| Date | Buyer | Sale Price | Title Company |
|---|---|---|---|
| Nurse Cella B | -- | None Available | |
| Nurse Cella B | -- | Chicago Title Co | |
| Nurse Oswald F | $130,000 | South Coast Title Co | |
| Barclaysamerican Mtg Corp | $115,453 | Northern Counties Title Ins | |
| -- | $168,500 | -- | |
| -- | $96,400 | -- |
Source: Public Records
Mortgage History
| Date | Status | Borrower | Loan Amount |
|---|---|---|---|
| Open | Nurse Cella B | $148,500 | |
| Closed | Nurse Oswald F | $129,700 |
Source: Public Records
Tax History
| Year | Tax Paid | Tax Assessment Tax Assessment Total Assessment is a certain percentage of the fair market value that is determined by local assessors to be the total taxable value of land and additions on the property. | Land | Improvement |
|---|---|---|---|---|
| 2025 | $2,361 | $217,822 | $75,394 | $142,428 |
| 2024 | $2,361 | $213,552 | $73,916 | $139,636 |
| 2023 | $2,286 | $209,366 | $72,467 | $136,899 |
| 2022 | $2,250 | $205,262 | $71,047 | $134,215 |
| 2021 | $2,258 | $201,238 | $69,654 | $131,584 |
| 2020 | $2,188 | $199,175 | $68,940 | $130,235 |
| 2019 | $2,124 | $195,271 | $67,589 | $127,682 |
| 2018 | $2,100 | $191,443 | $66,264 | $125,179 |
| 2017 | $2,060 | $187,690 | $64,965 | $122,725 |
| 2016 | $1,992 | $184,011 | $63,692 | $120,319 |
| 2015 | $1,933 | $181,248 | $62,736 | $118,512 |
| 2014 | $1,859 | $177,699 | $61,508 | $116,191 |
Source: Public Records
Map
Nearby Homes
- 4786 Macadamia Ct
- 4791 Macadamia Ct
- 255 Flame Tree Place
- 185 Harrison St
- 154 Harrison St
- 4798 Calle Los Santos
- 4918 Roja Dr
- 4750 Calle Estrella
- 4781 Calle Las Positas
- 761 Masters Dr
- 5063 Waterview Way
- 5065 Waterview Way
- 5108 Andrew Jackson St
- 4950 Luna Dr
- 4924 Verde Dr
- 5010 Golondrina Way Unit 64
- 5033 Los Morros Way Unit 55
- 436 W Redondo Dr
- 4877 Merida Way
- 4885 Merida Way
- 4817 Ceanothus Place
- 4809 Ceanothus Place
- 4827 Sagina Ct
- 4821 Ceanothus Place
- 4805 Ceanothus Place
- 4831 Sagina Ct
- 4825 Ceanothus Place
- 4814 Ceanothus Place
- 4810 Ceanothus Place
- 4818 Ceanothus Place
- 4835 Sagina Ct Unit 6
- 4806 Ceanothus Place
- 4822 Ceanothus Place
- 4829 Ceanothus Place
- 4839 Sagina Ct
- 4826 Ceanothus Place
- 4785 Sequoia Place
- 4833 Ceanothus Place
- 4811 Gardenia St
- 4830 Ceanothus Place
Your Personal Tour Guide
Ask me questions while you tour the home.