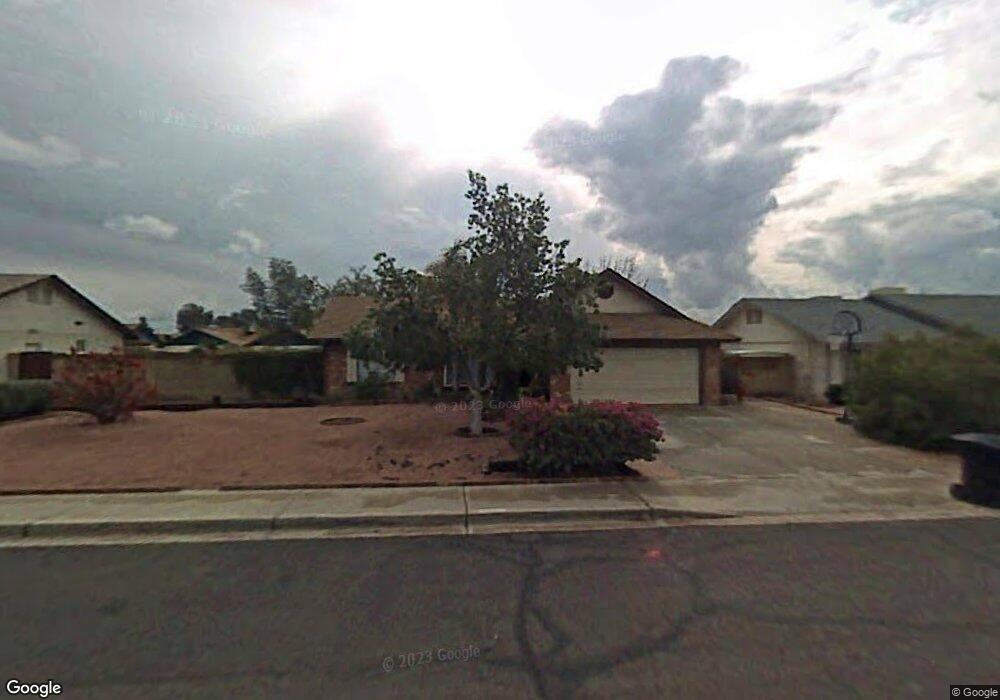
4813 E Fountain St Mesa, AZ 85205
Central Mesa East NeighborhoodEstimated Value: $352,710 - $437,000
--
Bed
2
Baths
1,200
Sq Ft
$342/Sq Ft
Est. Value
About This Home
This home is located at 4813 E Fountain St, Mesa, AZ 85205 and is currently estimated at $410,678, approximately $342 per square foot. 4813 E Fountain St is a home located in Maricopa County with nearby schools including O'Connor Elementary School, Franklin at Brimhall Elementary School, and Franklin West Elementary School.
Ownership History
Date
Name
Owned For
Owner Type
Purchase Details
Closed on
Dec 22, 2000
Sold by
Va
Bought by
Valenzuela Meliton R and Valenzuela Elizabeth
Current Estimated Value
Home Financials for this Owner
Home Financials are based on the most recent Mortgage that was taken out on this home.
Original Mortgage
$124,555
Outstanding Balance
$45,734
Interest Rate
7.65%
Mortgage Type
Seller Take Back
Estimated Equity
$364,944
Purchase Details
Closed on
Jul 17, 2000
Sold by
Cloud Christina L
Bought by
Countrywide Home Loans Inc
Purchase Details
Closed on
Feb 17, 2000
Sold by
Countrywide Home Loans Inc
Bought by
Va
Purchase Details
Closed on
Aug 12, 1997
Sold by
Maxwell Dorothy L
Bought by
Cloud Christina L
Home Financials for this Owner
Home Financials are based on the most recent Mortgage that was taken out on this home.
Original Mortgage
$91,698
Interest Rate
7.42%
Mortgage Type
VA
Create a Home Valuation Report for This Property
The Home Valuation Report is an in-depth analysis detailing your home's value as well as a comparison with similar homes in the area
Home Values in the Area
Average Home Value in this Area
Purchase History
| Date | Buyer | Sale Price | Title Company |
|---|---|---|---|
| Valenzuela Meliton R | -- | -- | |
| Countrywide Home Loans Inc | $97,101 | Stewart Title & Trust | |
| Va | -- | Stewart Title & Trust | |
| Cloud Christina L | $89,900 | Security Title Agency |
Source: Public Records
Mortgage History
| Date | Status | Borrower | Loan Amount |
|---|---|---|---|
| Open | Valenzuela Meliton R | $124,555 | |
| Previous Owner | Cloud Christina L | $91,698 |
Source: Public Records
Tax History Compared to Growth
Tax History
| Year | Tax Paid | Tax Assessment Tax Assessment Total Assessment is a certain percentage of the fair market value that is determined by local assessors to be the total taxable value of land and additions on the property. | Land | Improvement |
|---|---|---|---|---|
| 2025 | $1,503 | $15,239 | -- | -- |
| 2024 | $1,508 | $14,514 | -- | -- |
| 2023 | $1,508 | $29,300 | $5,860 | $23,440 |
| 2022 | $1,477 | $22,570 | $4,510 | $18,060 |
| 2021 | $1,495 | $20,900 | $4,180 | $16,720 |
| 2020 | $1,475 | $18,900 | $3,780 | $15,120 |
| 2019 | $1,379 | $16,680 | $3,330 | $13,350 |
| 2018 | $1,323 | $15,150 | $3,030 | $12,120 |
| 2017 | $1,284 | $13,120 | $2,620 | $10,500 |
| 2016 | $1,260 | $12,760 | $2,550 | $10,210 |
| 2015 | $1,184 | $12,120 | $2,420 | $9,700 |
Source: Public Records
Map
Nearby Homes
- 4752 E Encanto St
- 4725 E Brown Rd Unit 57
- 4725 E Brown Rd Unit 79
- 4860 E Enrose St
- 4949 E Gary St
- 1127 N Quinn
- 5038 E Glencove St
- 4518 E Fountain St
- 4919 E Dixon Cir
- 5136 E Evergreen St Unit 1031
- 5136 E Evergreen St Unit 1117
- 5136 E Evergreen St Unit 1090
- 5136 E Evergreen St Unit 1053
- 5136 E Evergreen St Unit 1105
- 737 N Regent
- 5135 E Evergreen St Unit 1260
- 5135 E Evergreen St Unit 1165
- 4933 E Downing St
- 5211 E Elmwood Cir
- 5008 E Dallas St
- 4805 E Fountain St
- 4821 E Fountain St
- 4812 E Fairfield St
- 4820 E Fairfield St
- 4804 E Fairfield St
- 4810 E Fountain St
- 4818 E Fountain St
- 4829 E Fountain St
- 4828 E Fairfield St
- 4823 E Fairfield St
- 4802 E Fountain St
- 4826 E Fountain St
- 4836 E Fairfield St
- 4837 E Fountain St
- 4811 E Fairfield St
- 4834 E Fountain St
- 4819 E Fairfield St
- 4803 E Fairfield St
- 4827 E Fairfield St
- 4844 E Fairfield St