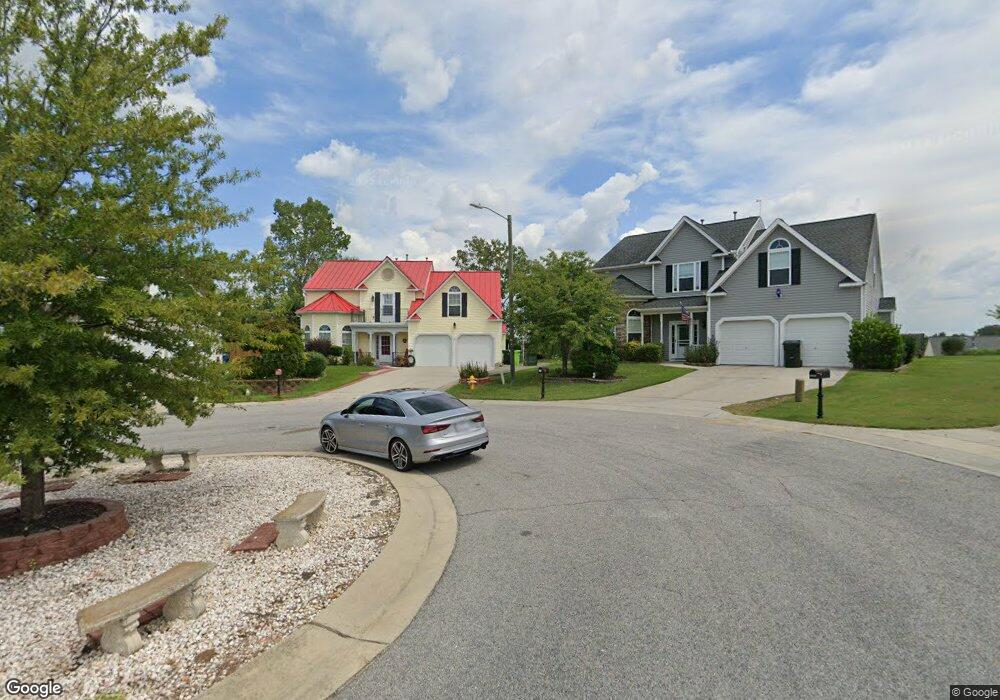
4813 Fourfoot Ct Raleigh, NC 27616
Northeast Raleigh NeighborhoodEstimated Value: $424,000 - $436,111
4
Beds
4
Baths
2,294
Sq Ft
$188/Sq Ft
Est. Value
About This Home
This home is located at 4813 Fourfoot Ct, Raleigh, NC 27616 and is currently estimated at $430,528, approximately $187 per square foot. 4813 Fourfoot Ct is a home located in Wake County with nearby schools including River Bend Elementary, River Bend Middle, and Rolesville High School.
Ownership History
Date
Name
Owned For
Owner Type
Purchase Details
Closed on
Nov 17, 2023
Sold by
Romero-Turcios Gloria Luz and Angel Rogeli
Bought by
Benavides Edgar Rolando Orel and Alicia Esmeralda Ji De Orellana
Current Estimated Value
Purchase Details
Closed on
Jan 29, 2020
Sold by
Romero Victor M and Romero Rhina L
Bought by
Romero Turcios Gloria Luz and Tejeda Angel Rogelio Turcios
Home Financials for this Owner
Home Financials are based on the most recent Mortgage that was taken out on this home.
Original Mortgage
$126,000
Interest Rate
3.37%
Mortgage Type
New Conventional
Purchase Details
Closed on
Jun 30, 2006
Sold by
Logan American Homes Llc
Bought by
Romero Victor M and Romero Rhina L
Home Financials for this Owner
Home Financials are based on the most recent Mortgage that was taken out on this home.
Original Mortgage
$158,908
Interest Rate
6.67%
Mortgage Type
Purchase Money Mortgage
Create a Home Valuation Report for This Property
The Home Valuation Report is an in-depth analysis detailing your home's value as well as a comparison with similar homes in the area
Home Values in the Area
Average Home Value in this Area
Purchase History
| Date | Buyer | Sale Price | Title Company |
|---|---|---|---|
| Benavides Edgar Rolando Orel | $110,000 | None Listed On Document | |
| Romero Turcios Gloria Luz | $158,000 | None Available | |
| Romero Victor M | $202,000 | Market Title Insurance Co |
Source: Public Records
Mortgage History
| Date | Status | Borrower | Loan Amount |
|---|---|---|---|
| Previous Owner | Romero Turcios Gloria Luz | $126,000 | |
| Previous Owner | Romero Victor M | $158,908 |
Source: Public Records
Tax History Compared to Growth
Tax History
| Year | Tax Paid | Tax Assessment Tax Assessment Total Assessment is a certain percentage of the fair market value that is determined by local assessors to be the total taxable value of land and additions on the property. | Land | Improvement |
|---|---|---|---|---|
| 2025 | $3,696 | $421,541 | $80,000 | $341,541 |
| 2024 | $3,681 | $421,541 | $80,000 | $341,541 |
| 2023 | $2,891 | $263,393 | $38,000 | $225,393 |
| 2022 | $2,687 | $263,393 | $38,000 | $225,393 |
| 2021 | $2,583 | $263,393 | $38,000 | $225,393 |
| 2020 | $2,536 | $263,393 | $38,000 | $225,393 |
| 2019 | $2,476 | $211,914 | $38,000 | $173,914 |
| 2018 | $2,335 | $211,914 | $38,000 | $173,914 |
| 2017 | $2,225 | $211,914 | $38,000 | $173,914 |
| 2016 | $2,179 | $211,914 | $38,000 | $173,914 |
| 2015 | $2,294 | $219,570 | $30,000 | $189,570 |
| 2014 | $2,176 | $219,570 | $30,000 | $189,570 |
Source: Public Records
Map
Nearby Homes
- 4809 Kaycee Ct
- 4809 Elmhurst Ridge Ct
- 4721 Mocha Ln
- 4416 Major Loring Way
- 4604 Treadstone Ct
- 4821 Heathshire Dr
- 4416 Brintons Cottage St
- 4508 Centrebrook Cir
- 4522 Centrebrook Cir
- 5208 Windmere Chase Dr
- 4500 Rivershyre Way
- 4809 Arbor Chase Dr
- 4236 Saubranch Hill St
- 4508 Brintons Cottage St
- 4800 Arbor Lodge Dr
- 5012 Silverdene St
- 4416 Walker Hallow St
- 5325 Marthonna Way
- 4208 Reddington Trail
- 4443 Antique Ln Unit D1
- 4809 Fourfoot Ct
- 4816 Fourfoot Ct
- 4905 Alenja Ln
- 4909 Alenja Ln
- 4901 Alenja Ln
- 4805 Fourfoot Ct
- 4917 Alenja Ln
- 4925 Alenja Ln
- 4829 Alenja Ln Unit 197
- 5005 Alenja Ln
- 4808 Fourfoot Ct Unit 188
- 4808 Fourfoot Ct
- 4804 Fourfoot Ct
- 4713 Alenja Ln
- 4709 Alenja Ln
- 5013 Alenja Ln
- 4904 Alenja Ln
- 4908 Alenja Ln
- 4717 Alenja Ln
- 4705 Alenja Ln