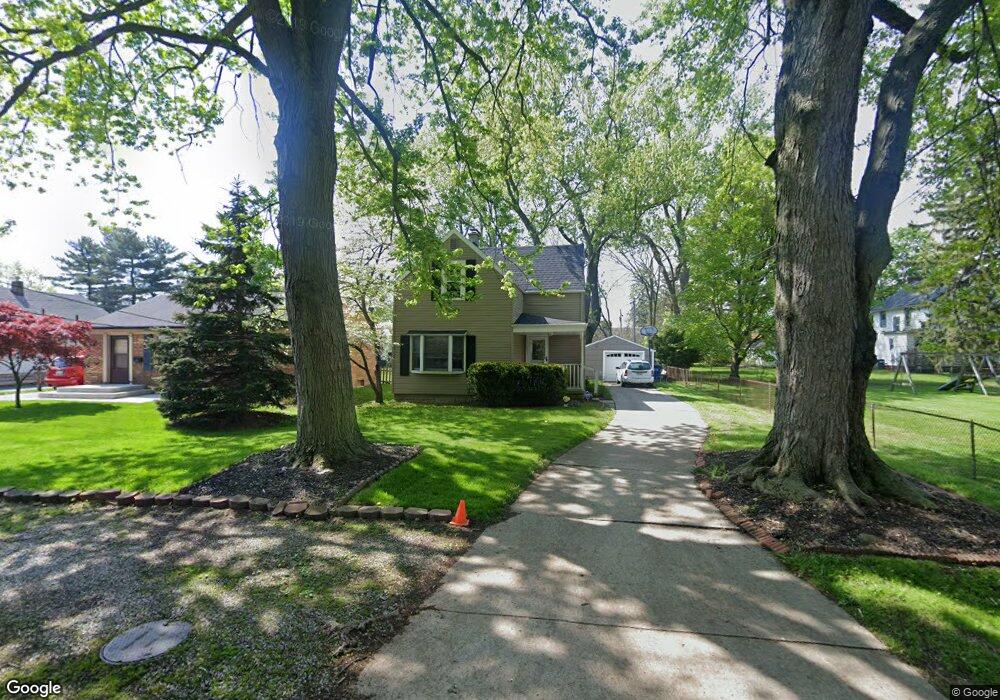
4813 Thobe Rd Toledo, OH 43615
Reynolds Corners NeighborhoodEstimated Value: $155,822 - $177,000
3
Beds
1
Bath
1,206
Sq Ft
$136/Sq Ft
Est. Value
About This Home
This home is located at 4813 Thobe Rd, Toledo, OH 43615 and is currently estimated at $163,706, approximately $135 per square foot. 4813 Thobe Rd is a home located in Lucas County with nearby schools including Hawkins Elementary School, Rogers High School, and Victory Academy of Toledo.
Ownership History
Date
Name
Owned For
Owner Type
Purchase Details
Closed on
Sep 22, 2006
Sold by
Johnson Mark A and Johnson Suzan L
Bought by
Cleavenger William D
Current Estimated Value
Home Financials for this Owner
Home Financials are based on the most recent Mortgage that was taken out on this home.
Original Mortgage
$99,299
Outstanding Balance
$59,340
Interest Rate
6.58%
Mortgage Type
Purchase Money Mortgage
Estimated Equity
$104,366
Purchase Details
Closed on
Mar 11, 1999
Sold by
Kelsey Daniel J and Kelsey Susan M
Bought by
Johnson Mark A and Johnson Susan L
Home Financials for this Owner
Home Financials are based on the most recent Mortgage that was taken out on this home.
Original Mortgage
$65,950
Interest Rate
6.78%
Mortgage Type
FHA
Purchase Details
Closed on
Oct 7, 1992
Sold by
Zalewski Robert J and Zalewski Lori A
Purchase Details
Closed on
Dec 8, 1988
Sold by
Thompson Edward H
Create a Home Valuation Report for This Property
The Home Valuation Report is an in-depth analysis detailing your home's value as well as a comparison with similar homes in the area
Home Values in the Area
Average Home Value in this Area
Purchase History
| Date | Buyer | Sale Price | Title Company |
|---|---|---|---|
| Cleavenger William D | $99,300 | None Available | |
| Johnson Mark A | $66,000 | Louisville Title Agency For | |
| -- | $48,500 | -- | |
| -- | $33,000 | -- |
Source: Public Records
Mortgage History
| Date | Status | Borrower | Loan Amount |
|---|---|---|---|
| Open | Cleavenger William D | $99,299 | |
| Previous Owner | Johnson Mark A | $65,950 |
Source: Public Records
Tax History Compared to Growth
Tax History
| Year | Tax Paid | Tax Assessment Tax Assessment Total Assessment is a certain percentage of the fair market value that is determined by local assessors to be the total taxable value of land and additions on the property. | Land | Improvement |
|---|---|---|---|---|
| 2024 | $1,172 | $37,765 | $5,915 | $31,850 |
| 2023 | $1,717 | $25,830 | $4,550 | $21,280 |
| 2022 | $1,705 | $25,830 | $4,550 | $21,280 |
| 2021 | $1,762 | $25,830 | $4,550 | $21,280 |
| 2020 | $1,673 | $21,350 | $3,780 | $17,570 |
| 2019 | $1,617 | $21,350 | $3,780 | $17,570 |
| 2018 | $1,623 | $21,350 | $3,780 | $17,570 |
| 2017 | $1,529 | $19,285 | $6,020 | $13,265 |
| 2016 | $1,538 | $55,100 | $17,200 | $37,900 |
| 2015 | $1,550 | $55,100 | $17,200 | $37,900 |
| 2014 | $1,213 | $19,290 | $6,020 | $13,270 |
| 2013 | $1,213 | $19,290 | $6,020 | $13,270 |
Source: Public Records
Map
Nearby Homes
- 5051 Wissman Rd
- 801 Hilltop Ln
- 2026 Pautucket Rd
- 5041 Ancil Rd
- 5057 Brandon Rd
- 710 Hilltop Ln
- 5029 Kellogg Rd
- 4709 W Bancroft St
- 4515 W Bancroft St
- 4519 W Bancroft St
- 4236 S Terrace View St
- 2009 Garden Ln
- 5331 Fleet Rd
- 1101 Sawyer Rd
- 2222 Talmadge Rd
- 4345 Foxchapel Rd
- 4057 Hillandale Rd
- 2130 Richards Rd
- 4248 Hunters Trail Dr
- 4860 Airport Hwy