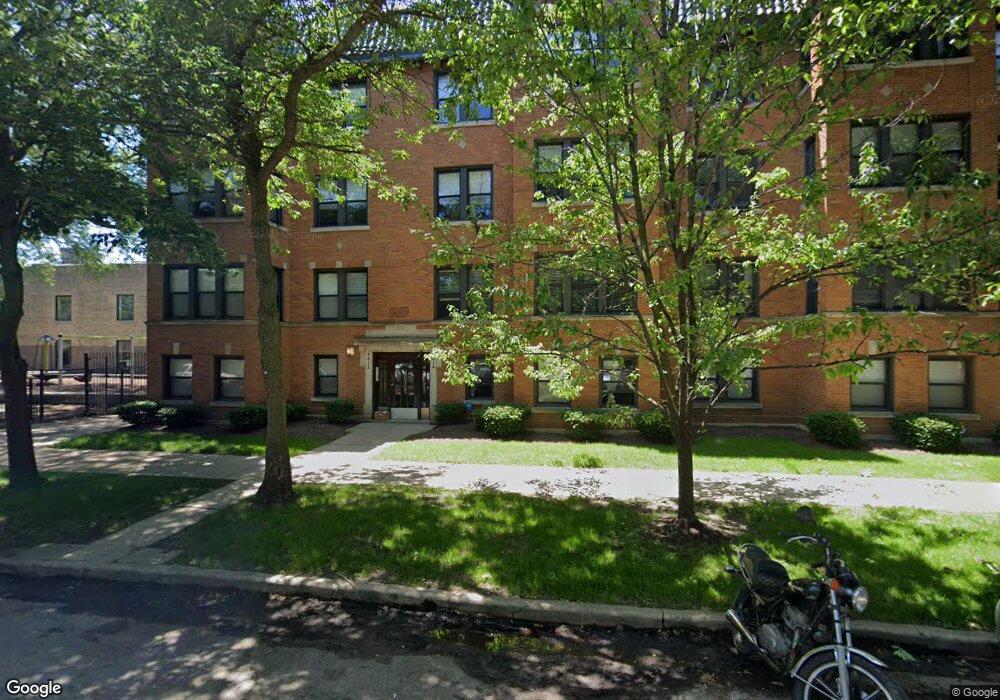
4814 N Hoyne Ave Unit 48144 Chicago, IL 60625
Ravenswood NeighborhoodEstimated Value: $392,000 - $564,000
--
Bed
--
Bath
--
Sq Ft
0.64
Acres
About This Home
This home is located at 4814 N Hoyne Ave Unit 48144, Chicago, IL 60625 and is currently estimated at $456,108. 4814 N Hoyne Ave Unit 48144 is a home located in Cook County with nearby schools including McPherson Elementary School, Amundsen High School, and Lycee Francais de Chicago.
Ownership History
Date
Name
Owned For
Owner Type
Purchase Details
Closed on
Aug 1, 2014
Sold by
Gonzales Jason and Gylling Natalie K
Bought by
Mernick Elaine
Current Estimated Value
Home Financials for this Owner
Home Financials are based on the most recent Mortgage that was taken out on this home.
Original Mortgage
$255,850
Outstanding Balance
$197,889
Interest Rate
4.5%
Mortgage Type
New Conventional
Estimated Equity
$258,219
Purchase Details
Closed on
Aug 4, 2010
Sold by
Skyline Construction & Development Corpo
Bought by
Gylling Natalie and Gonzales Jason
Home Financials for this Owner
Home Financials are based on the most recent Mortgage that was taken out on this home.
Original Mortgage
$240,000
Interest Rate
4.58%
Mortgage Type
New Conventional
Create a Home Valuation Report for This Property
The Home Valuation Report is an in-depth analysis detailing your home's value as well as a comparison with similar homes in the area
Home Values in the Area
Average Home Value in this Area
Purchase History
| Date | Buyer | Sale Price | Title Company |
|---|---|---|---|
| Mernick Elaine | $317,500 | Stewart Title | |
| Gylling Natalie | $300,000 | None Available |
Source: Public Records
Mortgage History
| Date | Status | Borrower | Loan Amount |
|---|---|---|---|
| Open | Mernick Elaine | $255,850 | |
| Previous Owner | Gylling Natalie | $240,000 |
Source: Public Records
Tax History Compared to Growth
Tax History
| Year | Tax Paid | Tax Assessment Tax Assessment Total Assessment is a certain percentage of the fair market value that is determined by local assessors to be the total taxable value of land and additions on the property. | Land | Improvement |
|---|---|---|---|---|
| 2024 | $5,841 | $34,775 | $10,704 | $24,071 |
| 2023 | $5,672 | $31,001 | $8,607 | $22,394 |
| 2022 | $5,672 | $31,001 | $8,607 | $22,394 |
| 2021 | $6,234 | $30,999 | $8,606 | $22,393 |
| 2020 | $5,837 | $26,201 | $4,518 | $21,683 |
| 2019 | $5,809 | $28,911 | $4,518 | $24,393 |
| 2018 | $5,711 | $28,911 | $4,518 | $24,393 |
| 2017 | $5,285 | $24,551 | $3,872 | $20,679 |
| 2016 | $4,917 | $24,551 | $3,872 | $20,679 |
| 2015 | $4,499 | $24,551 | $3,872 | $20,679 |
| 2014 | $4,876 | $28,847 | $2,904 | $25,943 |
| 2013 | $4,768 | $28,847 | $2,904 | $25,943 |
Source: Public Records
Map
Nearby Homes
- 4814 N Damen Ave Unit 209
- 2135 W Leland Ave
- 4906 N Winchester Ave
- 4726 N Winchester Ave Unit C
- 4726 N Winchester Ave Unit F
- 2248 W Ainslie St
- 1949 W Argyle St Unit 19491
- 4948 N Winchester Ave
- 2224 W Eastwood Ave
- 5015 N Damen Ave
- 4909 N Wolcott Ave Unit 2B
- 4947 N Wolcott Ave Unit 1B
- 4929 N Wolcott Ave Unit 1A
- 5401-5447 N Wolcott Ave
- 5013 N Wolcott Ave Unit 3W
- 2201 W Winona St Unit 2201G
- 4700 N Western Ave Unit 4B
- 2034 W Sunnyside Ave
- 5011 N Western Ave
- 4745 N Ravenswood Ave Unit 210
- 4814 N Hoyne Ave Unit 48143
- 4814 N Hoyne Ave Unit 48142
- 4814 N Hoyne Ave Unit 48141
- 4814 N Hoyne Ave Unit 1
- 4814 N Hoyne Ave Unit 4
- 4814 N Hoyne Ave Unit 3
- 4814 N Hoyne Ave Unit 2
- 4818 N Hoyne Ave Unit 4
- 4818 N Hoyne Ave Unit 4
- 4818 N Hoyne Ave Unit 48184
- 4818 N Hoyne Ave Unit 48183
- 4818 N Hoyne Ave Unit 48181
- 4818 N Hoyne Ave Unit 48182
- 4818 N Hoyne Ave Unit 2
- 4820 N Hoyne Ave Unit 3
- 4820 N Hoyne Ave Unit 48204
- 4820 N Hoyne Ave Unit 48203
- 4820 N Hoyne Ave Unit 48202
- 4820 N Hoyne Ave Unit 48201
- 4820 N Hoyne Ave Unit 4