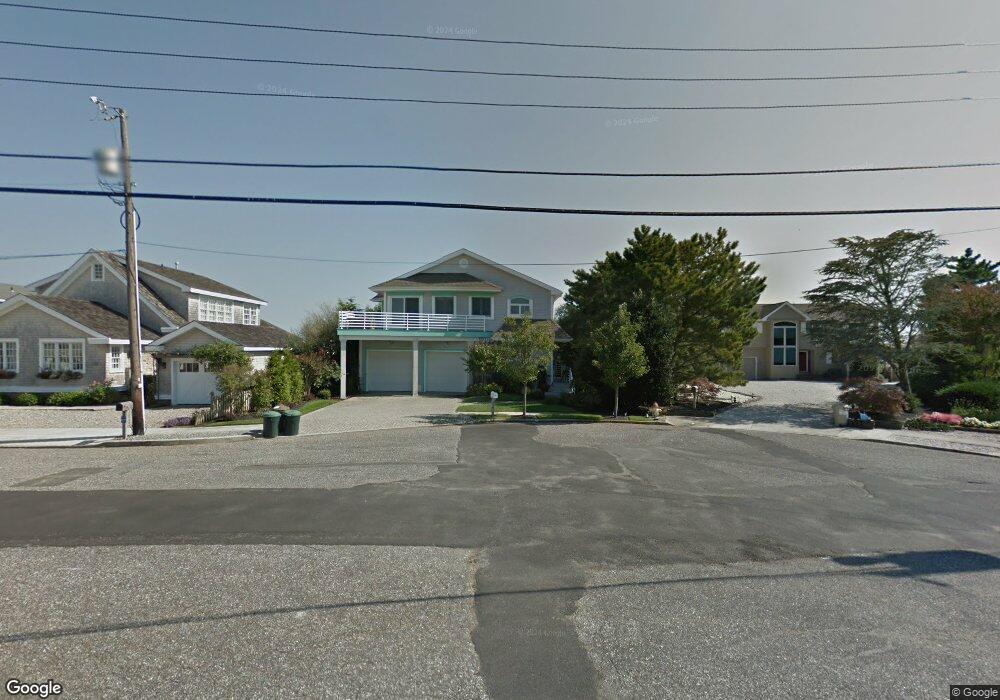
4815 4th Ave Avalon, NJ 08202
Estimated Value: $3,671,000 - $5,591,000
--
Bed
--
Bath
3,414
Sq Ft
$1,393/Sq Ft
Est. Value
About This Home
This home is located at 4815 4th Ave, Avalon, NJ 08202 and is currently estimated at $4,755,955, approximately $1,393 per square foot. 4815 4th Ave is a home located in Cape May County with nearby schools including Avalon Elementary School.
Ownership History
Date
Name
Owned For
Owner Type
Purchase Details
Closed on
Mar 27, 2013
Sold by
Green Rachel
Bought by
Doherty Niall T and Doherty Mary S
Current Estimated Value
Purchase Details
Closed on
May 8, 1991
Sold by
Held Robert F and Held Evelyn F
Bought by
Green Rachel
Purchase Details
Closed on
Oct 7, 1988
Sold by
Piotrowicz Chester and Piotrowicz Stella
Bought by
Held Robert and Held Evelyn
Create a Home Valuation Report for This Property
The Home Valuation Report is an in-depth analysis detailing your home's value as well as a comparison with similar homes in the area
Home Values in the Area
Average Home Value in this Area
Purchase History
| Date | Buyer | Sale Price | Title Company |
|---|---|---|---|
| Doherty Niall T | $1,500,000 | Seaboard Title Agency | |
| Green Rachel | $510,000 | -- | |
| Held Robert | $395,000 | -- |
Source: Public Records
Tax History Compared to Growth
Tax History
| Year | Tax Paid | Tax Assessment Tax Assessment Total Assessment is a certain percentage of the fair market value that is determined by local assessors to be the total taxable value of land and additions on the property. | Land | Improvement |
|---|---|---|---|---|
| 2025 | $15,840 | $2,579,800 | $1,700,000 | $879,800 |
| 2024 | $15,840 | $2,579,800 | $1,700,000 | $879,800 |
| 2023 | $15,697 | $2,577,500 | $1,700,000 | $877,500 |
| 2022 | $14,640 | $2,577,500 | $1,700,000 | $877,500 |
| 2021 | $14,099 | $2,577,500 | $1,700,000 | $877,500 |
| 2020 | $13,558 | $2,577,500 | $1,700,000 | $877,500 |
| 2019 | $11,427 | $2,240,500 | $1,700,000 | $540,500 |
| 2018 | $10,934 | $2,240,500 | $1,700,000 | $540,500 |
| 2017 | $11,596 | $2,085,600 | $1,600,000 | $485,600 |
| 2016 | $11,471 | $2,085,600 | $1,600,000 | $485,600 |
| 2015 | $11,283 | $1,880,300 | $1,600,000 | $280,300 |
| 2014 | -- | $1,880,300 | $1,600,000 | $280,300 |
Source: Public Records
Map
Nearby Homes
- 4640 Ocean Dr
- 4610 4th Ave
- 5499 Dune Dr
- 264 41st St
- 245 57th St
- 5765 Ocean Dr
- 22 Pelican Dr S
- 74 38th St
- 6229 Dune Dr
- 253 35th St Unit WEST
- 3429 Dune Dr
- 150 64th St
- 162 33rd St
- 173 33rd St Unit 3
- 158 32nd St
- 179 32nd St
- 3149 First Ave
- 55 32nd St W Unit C2B
- 6762 Ocean Dr Unit 6762
- 6772 Ocean Dr Unit 6772