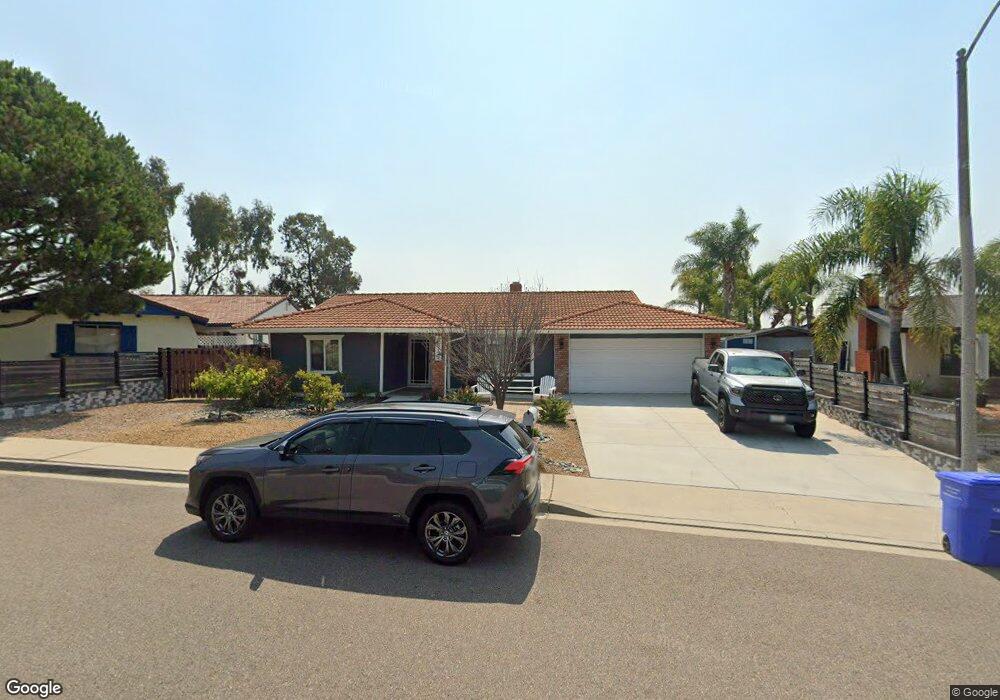
4815 Neblina Dr Carlsbad, CA 92008
Olde Carlsbad NeighborhoodEstimated Value: $1,410,000 - $1,644,000
3
Beds
2
Baths
1,585
Sq Ft
$942/Sq Ft
Est. Value
About This Home
This home is located at 4815 Neblina Dr, Carlsbad, CA 92008 and is currently estimated at $1,492,564, approximately $941 per square foot. 4815 Neblina Dr is a home located in San Diego County with nearby schools including Kelly Elementary School, Carlsbad High School, and Sage Creek High.
Ownership History
Date
Name
Owned For
Owner Type
Purchase Details
Closed on
Apr 18, 2008
Sold by
Rosen Leanora A
Bought by
Espinoza James and Espinoza Kattie
Current Estimated Value
Home Financials for this Owner
Home Financials are based on the most recent Mortgage that was taken out on this home.
Original Mortgage
$516,888
Outstanding Balance
$324,685
Interest Rate
5.81%
Mortgage Type
VA
Estimated Equity
$1,167,879
Purchase Details
Closed on
Nov 30, 2006
Sold by
Rosen Leanora A
Bought by
Rosen Leanora A
Home Financials for this Owner
Home Financials are based on the most recent Mortgage that was taken out on this home.
Original Mortgage
$165,000
Interest Rate
7.6%
Mortgage Type
Negative Amortization
Purchase Details
Closed on
Jun 17, 1999
Sold by
Rosen Samuel & Leanora A Trs
Bought by
Rosen Samuel and Rosen Leonora A
Home Financials for this Owner
Home Financials are based on the most recent Mortgage that was taken out on this home.
Original Mortgage
$156,000
Interest Rate
7.05%
Create a Home Valuation Report for This Property
The Home Valuation Report is an in-depth analysis detailing your home's value as well as a comparison with similar homes in the area
Home Values in the Area
Average Home Value in this Area
Purchase History
| Date | Buyer | Sale Price | Title Company |
|---|---|---|---|
| Espinoza James | $540,000 | First American Title | |
| Rosen Leanora A | -- | United Title Company | |
| Rosen Samuel | -- | Commonwealth Land Title Co |
Source: Public Records
Mortgage History
| Date | Status | Borrower | Loan Amount |
|---|---|---|---|
| Open | Espinoza James | $516,888 | |
| Previous Owner | Rosen Leanora A | $165,000 | |
| Previous Owner | Rosen Samuel | $156,000 |
Source: Public Records
Tax History Compared to Growth
Tax History
| Year | Tax Paid | Tax Assessment Tax Assessment Total Assessment is a certain percentage of the fair market value that is determined by local assessors to be the total taxable value of land and additions on the property. | Land | Improvement |
|---|---|---|---|---|
| 2025 | $6,059 | $744,794 | $525,398 | $219,396 |
| 2024 | $6,059 | $730,192 | $515,097 | $215,095 |
| 2023 | $6,086 | $715,876 | $504,998 | $210,878 |
| 2022 | $6,078 | $701,841 | $495,097 | $206,744 |
| 2021 | $6,028 | $688,081 | $485,390 | $202,691 |
| 2020 | $6,018 | $681,026 | $480,413 | $200,613 |
| 2019 | $5,922 | $667,674 | $470,994 | $196,680 |
| 2018 | $5,695 | $654,583 | $461,759 | $192,824 |
| 2017 | $5,615 | $641,749 | $452,705 | $189,044 |
| 2016 | $6,746 | $629,167 | $443,829 | $185,338 |
| 2015 | $6,404 | $590,166 | $437,160 | $153,006 |
| 2014 | $5,670 | $520,000 | $385,000 | $135,000 |
Source: Public Records
Map
Nearby Homes
- 4814 Refugio Ave
- 4843 Flying Cloud Way
- 0 Sunny Creek Unit PI25230627
- 4781 Argosy Ln
- 4876 Park Dr
- 4874 Park Dr
- 4640 Sunburst Rd
- 4623 Telescope Ave
- 0 Park Dr
- 4735 Bryce Cir
- 2508 Chamomile Ln
- 2513 Delphinium Ln
- 1741 Bruce Rd
- 2541 Delphinium Ln
- 2559 Delphinium Ln
- 4672 Catmint Ln
- 4705 Marina Dr Unit 10
- 4700 Parsley Ln
- 4143 Sunnyhill Dr
- 4747 Marina Dr Unit 23
- 4817 Neblina Dr
- 4813 Neblina Dr
- 4820 Refugio Ave
- 4818 Refugio Ave
- 4819 Neblina Dr
- 4822 Refugio Ave
- 4811 Neblina Dr
- 4816 Neblina Dr
- 4824 Refugio Ave
- 4814 Neblina Dr
- 4818 Neblina Dr
- 4821 Neblina Dr
- 4809 Neblina Dr
- 4820 Neblina Dr
- 4812 Neblina Dr
- 2044 Cordoba Place
- 2042 Cordoba Place
- 4812 Refugio Ave
- 4810 Neblina Dr
- 4822 Neblina Dr