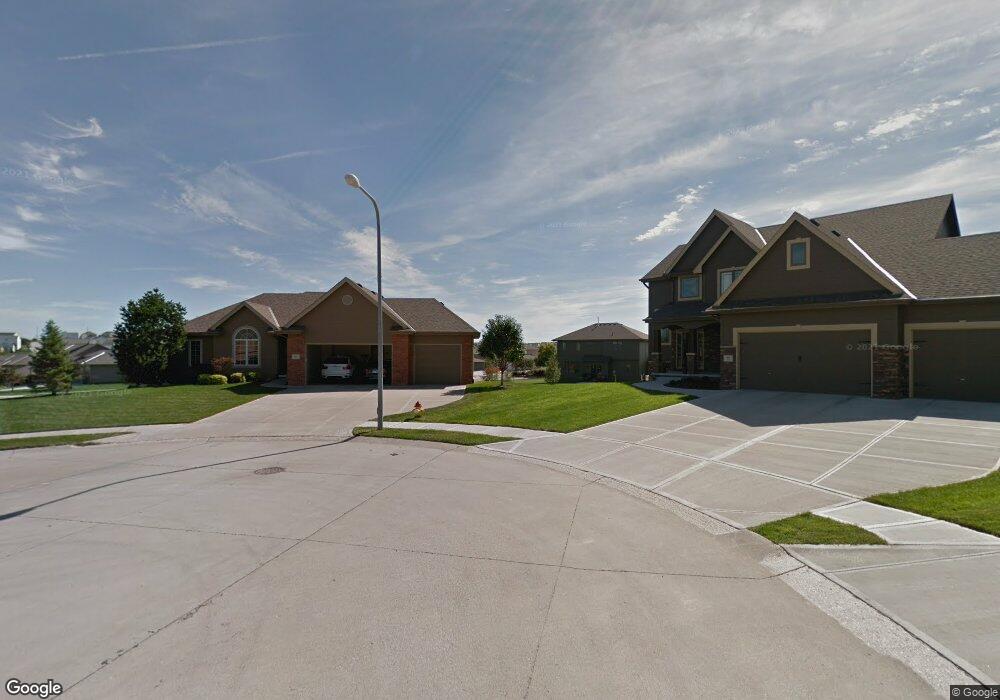
4815 S 198th Cir Omaha, NE 68135
Southwest Omaha NeighborhoodEstimated Value: $425,000 - $527,000
2
Beds
5
Baths
1,650
Sq Ft
$278/Sq Ft
Est. Value
About This Home
This home is located at 4815 S 198th Cir, Omaha, NE 68135 and is currently estimated at $458,244, approximately $277 per square foot. 4815 S 198th Cir is a home located in Douglas County with nearby schools including Reagan Elementary School, Beadle Middle School, and Millard West High School.
Ownership History
Date
Name
Owned For
Owner Type
Purchase Details
Closed on
Nov 10, 2015
Sold by
Slabaugh Carol A and Slabaugh Robert A
Bought by
Slabaugh Robert A and Slabaugh Carol A
Current Estimated Value
Home Financials for this Owner
Home Financials are based on the most recent Mortgage that was taken out on this home.
Original Mortgage
$229,950
Outstanding Balance
$175,339
Interest Rate
3%
Mortgage Type
Adjustable Rate Mortgage/ARM
Estimated Equity
$282,905
Purchase Details
Closed on
Sep 27, 2005
Sold by
Millenium Homes
Bought by
Shanahan Carol A
Purchase Details
Closed on
Apr 18, 2005
Sold by
Earl Allen Inc
Bought by
Millennium Homes Inc
Create a Home Valuation Report for This Property
The Home Valuation Report is an in-depth analysis detailing your home's value as well as a comparison with similar homes in the area
Home Values in the Area
Average Home Value in this Area
Purchase History
| Date | Buyer | Sale Price | Title Company |
|---|---|---|---|
| Slabaugh Robert A | -- | None Available | |
| Shanahan Carol A | $268,300 | -- | |
| Millennium Homes Inc | $30,800 | -- |
Source: Public Records
Mortgage History
| Date | Status | Borrower | Loan Amount |
|---|---|---|---|
| Open | Slabaugh Robert A | $229,950 |
Source: Public Records
Tax History Compared to Growth
Tax History
| Year | Tax Paid | Tax Assessment Tax Assessment Total Assessment is a certain percentage of the fair market value that is determined by local assessors to be the total taxable value of land and additions on the property. | Land | Improvement |
|---|---|---|---|---|
| 2025 | $7,967 | $366,600 | $47,700 | $318,900 |
| 2024 | $7,792 | $366,600 | $47,700 | $318,900 |
| 2023 | $7,792 | $314,600 | $47,700 | $266,900 |
| 2022 | $8,244 | $314,600 | $47,700 | $266,900 |
| 2021 | $7,577 | $288,100 | $47,700 | $240,400 |
| 2020 | $7,665 | $288,100 | $47,700 | $240,400 |
| 2019 | $7,622 | $287,100 | $77,200 | $209,900 |
| 2018 | $7,723 | $287,100 | $77,200 | $209,900 |
| 2017 | $7,618 | $287,100 | $77,200 | $209,900 |
| 2016 | $6,660 | $249,000 | $44,000 | $205,000 |
| 2015 | $6,641 | $249,000 | $44,000 | $205,000 |
| 2014 | $6,641 | $249,000 | $44,000 | $205,000 |
Source: Public Records
Map
Nearby Homes