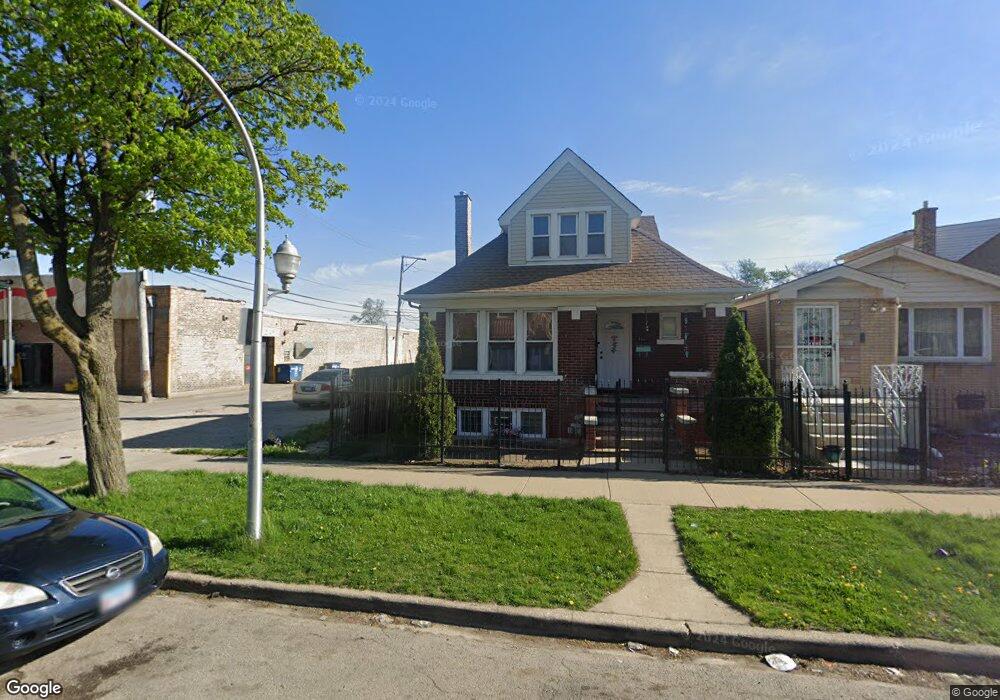
4815 W Saint Paul Ave Chicago, IL 60639
Austin NeighborhoodEstimated Value: $250,000 - $1,662,574
--
Bed
--
Bath
--
Sq Ft
0.84
Acres
About This Home
This home is located at 4815 W Saint Paul Ave, Chicago, IL 60639 and is currently estimated at $956,287. 4815 W Saint Paul Ave is a home located in Cook County with nearby schools including Lloyd Elementary School, Northwest Middle School, and Foreman College and Career Academy.
Ownership History
Date
Name
Owned For
Owner Type
Purchase Details
Closed on
Apr 20, 2022
Sold by
Yarbrough Karen A
Bought by
Longstreet Capital Funding Llc
Current Estimated Value
Purchase Details
Closed on
Sep 14, 2012
Sold by
Nelson Harry J
Bought by
Adrian Papavero Veronica G and Adrian Tiafierro
Purchase Details
Closed on
May 18, 2007
Sold by
Zmudzki Jesse
Bought by
Lubas Wieslaw
Purchase Details
Closed on
Apr 26, 2004
Sold by
Buckley Evelyn
Bought by
Zmudzki Jesse
Home Financials for this Owner
Home Financials are based on the most recent Mortgage that was taken out on this home.
Original Mortgage
$32,000
Interest Rate
4%
Mortgage Type
Unknown
Purchase Details
Closed on
Oct 1, 2003
Sold by
City Of Chicago
Bought by
Buckley Evelyn
Purchase Details
Closed on
Oct 5, 1999
Sold by
California Federal Bank
Bought by
City Of Chicago
Purchase Details
Closed on
Aug 8, 1997
Sold by
Williams
Bought by
California Federal Bank
Create a Home Valuation Report for This Property
The Home Valuation Report is an in-depth analysis detailing your home's value as well as a comparison with similar homes in the area
Home Values in the Area
Average Home Value in this Area
Purchase History
| Date | Buyer | Sale Price | Title Company |
|---|---|---|---|
| Longstreet Capital Funding Llc | -- | None Listed On Document | |
| Adrian Papavero Veronica G | $800,000 | None Available | |
| Lubas Wieslaw | $40,000 | None Available | |
| Zmudzki Jesse | $40,000 | Pntn | |
| Buckley Evelyn | -- | -- | |
| City Of Chicago | -- | -- | |
| California Federal Bank | -- | -- |
Source: Public Records
Mortgage History
| Date | Status | Borrower | Loan Amount |
|---|---|---|---|
| Previous Owner | Zmudzki Jesse | $32,000 |
Source: Public Records
Tax History Compared to Growth
Tax History
| Year | Tax Paid | Tax Assessment Tax Assessment Total Assessment is a certain percentage of the fair market value that is determined by local assessors to be the total taxable value of land and additions on the property. | Land | Improvement |
|---|---|---|---|---|
| 2024 | $1,156 | $6,760 | $6,760 | -- |
| 2023 | $1,127 | $5,481 | $5,481 | -- |
| 2022 | $1,127 | $5,481 | $5,481 | $0 |
| 2021 | $1,102 | $5,481 | $5,481 | $0 |
| 2020 | $895 | $4,019 | $4,019 | $0 |
| 2019 | $807 | $4,019 | $4,019 | $0 |
| 2018 | $794 | $4,019 | $4,019 | $0 |
| 2017 | $787 | $3,654 | $3,654 | $0 |
| 2016 | $732 | $3,654 | $3,654 | $0 |
| 2015 | $670 | $3,654 | $3,654 | $0 |
| 2014 | $610 | $3,288 | $3,288 | $0 |
| 2013 | $598 | $3,288 | $3,288 | $0 |
Source: Public Records
Map
Nearby Homes
- 4853 W Wabansia Ave
- 1748 N Keating Ave
- 1943 N La Crosse Ave
- 1534 N Lavergne Ave
- 5021 W Grand Ave
- 2035 N Cicero Ave
- 5004 W Armitage Ave
- 4637 W Mclean Ave
- 4718 W Le Moyne St
- 4157 W Armitage Ave
- 4600 W Armitage Ave
- 2015 N Leclaire Ave
- 1522 N Leamington Ave
- 1735 N Latrobe Ave
- 1930 N Kenneth Ave
- 5215 W Galewood Ave
- 2016 N Kilbourn Ave
- 5146 W Grand Ave
- 5241 W Galewood Ave
- 4830 W Crystal St
- 4817 W Saint Paul Ave
- 4819 W Saint Paul Ave
- 4823 W St Paul Ave
- 4823 W Saint Paul Ave
- 4827 W Saint Paul Ave
- 4831 W Saint Paul Ave
- 4820 W Saint Paul Ave
- 4820 W Saint Paul Ave
- 4816 W Saint Paul Ave
- 4818 W Saint Paul Ave
- 4814 W Wabansia Ave Unit 1
- 4835 W Saint Paul Ave
- 4824 W Saint Paul Ave
- 4824 W Saint Paul Ave
- 4816 W Wabansia Ave
- 4820 W Wabansia Ave
- 4826 W Saint Paul Ave
- 4822 W Wabansia Ave
- 4837 W Saint Paul Ave
- 4828 W Wabansia Ave