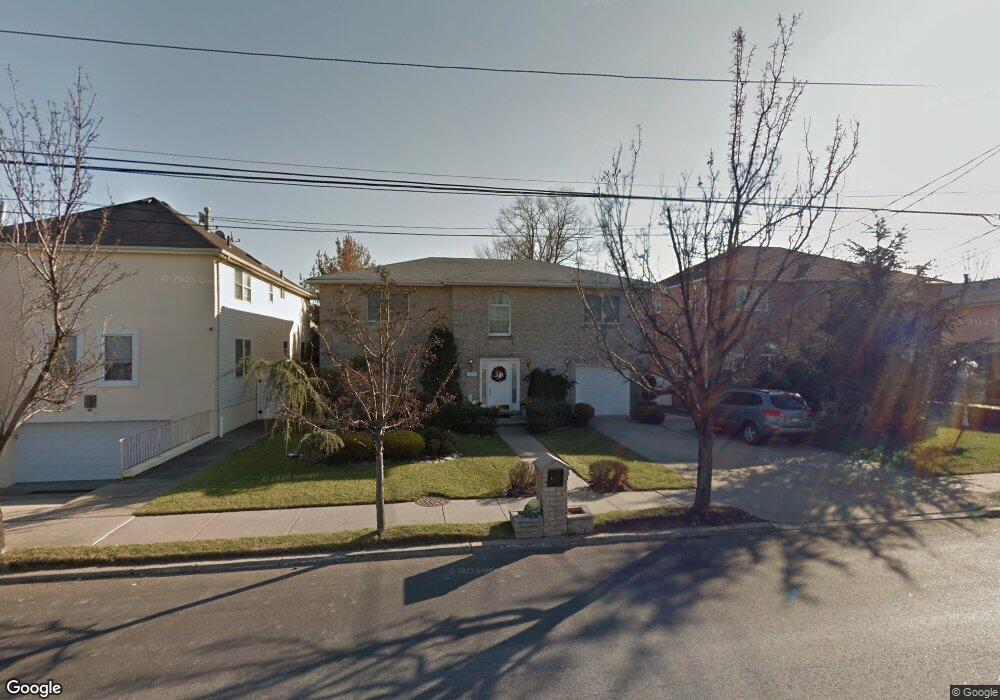
4816 Hylan Blvd Staten Island, NY 10312
Annadale NeighborhoodEstimated Value: $1,152,600 - $1,427,000
6
Beds
5
Baths
3,763
Sq Ft
$337/Sq Ft
Est. Value
About This Home
This home is located at 4816 Hylan Blvd, Staten Island, NY 10312 and is currently estimated at $1,269,900, approximately $337 per square foot. 4816 Hylan Blvd is a home located in Richmond County with nearby schools including P.S. 5 - Huguenot, I.S. 007 Elias Bernstein, and Tottenville High School.
Ownership History
Date
Name
Owned For
Owner Type
Purchase Details
Closed on
Jan 23, 2020
Sold by
Martino Peter D
Bought by
Martino Peter D and Martino Rose Ann
Current Estimated Value
Purchase Details
Closed on
Aug 28, 2019
Sold by
Martino Peter D and Martino Barbara
Bought by
Martino Rose Ann and Martino Peter D
Purchase Details
Closed on
Oct 4, 2011
Sold by
Martino Peter A and Martino Rose Ann
Bought by
Martino Peter D and Martino Barbara
Create a Home Valuation Report for This Property
The Home Valuation Report is an in-depth analysis detailing your home's value as well as a comparison with similar homes in the area
Home Values in the Area
Average Home Value in this Area
Purchase History
| Date | Buyer | Sale Price | Title Company |
|---|---|---|---|
| Martino Peter D | -- | Clearpoint Title Agency Llc | |
| Martino Peter D | -- | Prime Title & Settlement | |
| Martino Rose Ann | -- | Alr Abstract Services Llc | |
| Martino Peter D | -- | None Available |
Source: Public Records
Tax History Compared to Growth
Tax History
| Year | Tax Paid | Tax Assessment Tax Assessment Total Assessment is a certain percentage of the fair market value that is determined by local assessors to be the total taxable value of land and additions on the property. | Land | Improvement |
|---|---|---|---|---|
| 2025 | $11,493 | $55,080 | $20,645 | $34,435 |
| 2024 | $11,505 | $58,620 | $19,532 | $39,088 |
| 2023 | $11,831 | $59,657 | $15,781 | $43,876 |
| 2022 | $10,948 | $56,280 | $18,300 | $37,980 |
| 2021 | $10,897 | $53,220 | $18,300 | $34,920 |
| 2020 | $11,210 | $58,800 | $18,300 | $40,500 |
| 2019 | $10,248 | $52,140 | $18,300 | $33,840 |
| 2018 | $5,591 | $51,100 | $15,711 | $35,389 |
| 2017 | $9,181 | $48,208 | $17,672 | $30,536 |
| 2016 | $8,471 | $45,480 | $18,300 | $27,180 |
| 2015 | $8,085 | $45,300 | $15,240 | $30,060 |
| 2014 | $8,085 | $45,300 | $15,240 | $30,060 |
Source: Public Records
Map
Nearby Homes
- 705 Barclay Ave
- 750 Barclay Ave
- 456 Holdridge Ave
- 161 Boardwalk Ave
- 31 4th Ct
- 62 Bennett Place
- 41 Bennett Place
- 440 Harold Ave
- 47 Ravenna St
- 422 Harold Ave
- 45 Joanne Ct
- 262 Noel St
- 192 Bathgate St
- 84 Discala Ln
- 330 Shirley Ave
- 155 Bathgate St
- 69 Elmbank St
- 27 Mayberry Promenade
- 59 Newton St
- 344 Poillon Ave
- 104 Ryan Place
- 4826 Hylan Blvd
- 116 Ryan Place
- 661 Barclay Ave
- 673 Barclay Ave
- 103 Ryan Place
- 675 Barclay Ave
- 78 Ryan Place
- 124 Ryan Place
- 111 Ryan Place
- 4796 Hylan Blvd
- 4823 Hylan Blvd
- 639 Barclay Ave
- 4827 Hylan Blvd
- 677 Barclay Ave
- 72 Ryan Place
- 642 Barclay Ave
- 119 Ryan Place
- 77 Ryan Place
- 685 Barclay Ave