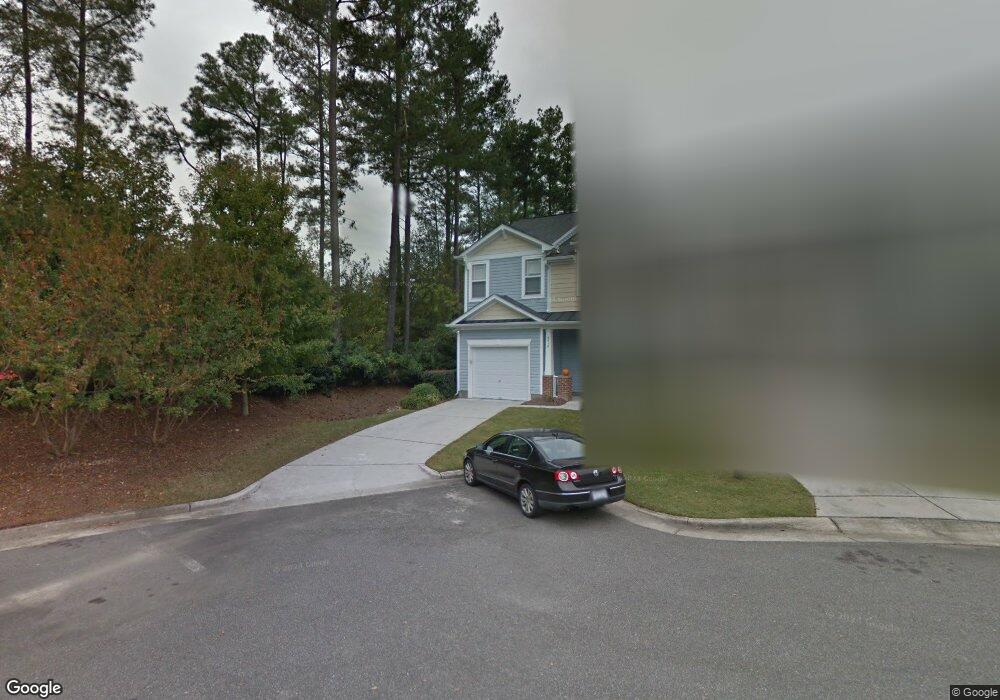
4816 Landover Vale Way Raleigh, NC 27616
Forestville NeighborhoodEstimated Value: $266,000 - $291,000
3
Beds
3
Baths
1,485
Sq Ft
$188/Sq Ft
Est. Value
About This Home
This home is located at 4816 Landover Vale Way, Raleigh, NC 27616 and is currently estimated at $278,446, approximately $187 per square foot. 4816 Landover Vale Way is a home located in Wake County with nearby schools including Forestville Road Elementary School, Neuse River Middle School, and Knightdale High.
Ownership History
Date
Name
Owned For
Owner Type
Purchase Details
Closed on
Nov 30, 2017
Sold by
Myers Jeanine N and Cooper Kevin W
Bought by
Sowe Pa Modu and Kah Mariamaa
Current Estimated Value
Home Financials for this Owner
Home Financials are based on the most recent Mortgage that was taken out on this home.
Original Mortgage
$163,400
Outstanding Balance
$137,355
Interest Rate
3.88%
Mortgage Type
New Conventional
Estimated Equity
$141,091
Purchase Details
Closed on
May 30, 2008
Sold by
Ross Construction Inc
Bought by
Mayers Jeanine N
Home Financials for this Owner
Home Financials are based on the most recent Mortgage that was taken out on this home.
Original Mortgage
$152,506
Interest Rate
5.86%
Mortgage Type
FHA
Purchase Details
Closed on
Jan 11, 2007
Sold by
Sanders Development Co Llc
Bought by
Ross Construction Inc
Create a Home Valuation Report for This Property
The Home Valuation Report is an in-depth analysis detailing your home's value as well as a comparison with similar homes in the area
Home Values in the Area
Average Home Value in this Area
Purchase History
| Date | Buyer | Sale Price | Title Company |
|---|---|---|---|
| Sowe Pa Modu | $172,000 | None Available | |
| Mayers Jeanine N | $155,000 | None Available | |
| Ross Construction Inc | $330,000 | None Available |
Source: Public Records
Mortgage History
| Date | Status | Borrower | Loan Amount |
|---|---|---|---|
| Open | Sowe Pa Modu | $163,400 | |
| Previous Owner | Mayers Jeanine N | $152,506 |
Source: Public Records
Tax History Compared to Growth
Tax History
| Year | Tax Paid | Tax Assessment Tax Assessment Total Assessment is a certain percentage of the fair market value that is determined by local assessors to be the total taxable value of land and additions on the property. | Land | Improvement |
|---|---|---|---|---|
| 2025 | $2,457 | $279,461 | $55,000 | $224,461 |
| 2024 | $2,447 | $279,461 | $55,000 | $224,461 |
| 2023 | $2,124 | $193,021 | $30,000 | $163,021 |
| 2022 | $1,974 | $193,021 | $30,000 | $163,021 |
| 2021 | $1,898 | $193,021 | $30,000 | $163,021 |
| 2020 | $1,864 | $193,021 | $30,000 | $163,021 |
| 2019 | $1,663 | $141,792 | $23,000 | $118,792 |
| 2018 | $1,569 | $141,792 | $23,000 | $118,792 |
| 2017 | $1,495 | $141,792 | $23,000 | $118,792 |
| 2016 | $1,465 | $141,792 | $23,000 | $118,792 |
| 2015 | $1,732 | $165,373 | $28,000 | $137,373 |
| 2014 | -- | $165,373 | $28,000 | $137,373 |
Source: Public Records
Map
Nearby Homes
- 4820 Landover Arbor Place
- 5332 River Reach Dr
- 5324 River Reach Dr
- 5322 River Reach Dr
- 5302 River Reach Dr
- 5200 Stream Stone Way
- 7002 Point Bar Place
- 7000 Point Bar Place
- 6952 Point Bar Place
- Dogwood B Plan at Riverwalk
- Dogwood A Plan at Riverwalk
- 5814 Empathy Ln
- 4060 Granite Ridge Trail
- 4050 Granite Ridge Trail
- 4912 Elizabeth Dr
- 6309 Truxton Ln
- 6626 Pathfinder Way
- 6620 Pathfinder Way
- 5523 Wallace Martin Way
- 6607 Pathfinder Way
- 4814 Landover Vale Way
- 4812 Landover Vale Way
- 4815 Landover Charge Ln
- 4813 Landover Charge Ln
- 4811 Landover Charge Ln
- 4808 Landover Vale Way
- 4809 Landover Charge Ln
- 4806 Landover Vale Way
- 4807 Landover Charge Ln
- 4804 Landover Vale Way
- 4805 Landover Charge Ln
- 4809 Landover Vale Way
- 4815 Landover Vale Way
- 4817 Landover Vale Way
- 4813 Landover Vale Way
- 4807 Landover Vale Way
- 4805 Landover Vale Way
- 0 Landover Charge Ln
- 4810 Landover Charge Ln
- 4808 Landover Charge Ln