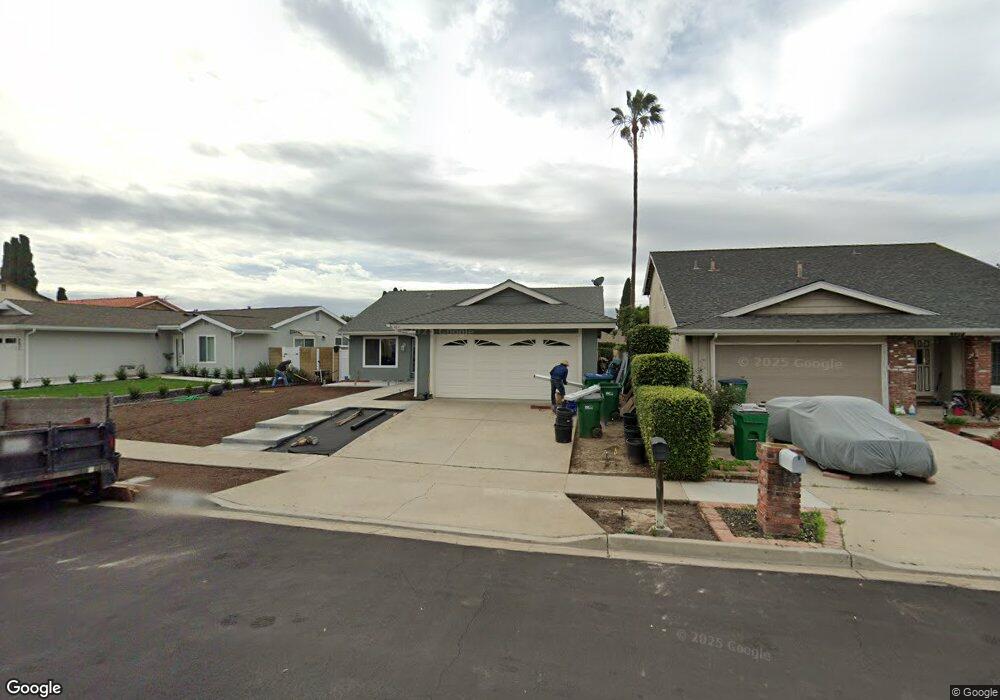
4816 Lindstrom Ave Irvine, CA 92604
Walnut NeighborhoodEstimated Value: $1,271,000 - $1,443,000
3
Beds
2
Baths
1,480
Sq Ft
$914/Sq Ft
Est. Value
About This Home
This home is located at 4816 Lindstrom Ave, Irvine, CA 92604 and is currently estimated at $1,352,127, approximately $913 per square foot. 4816 Lindstrom Ave is a home located in Orange County with nearby schools including Greentree Elementary School, Venado Middle School, and Irvine High School.
Ownership History
Date
Name
Owned For
Owner Type
Purchase Details
Closed on
Mar 6, 2025
Sold by
Douglass Madeline and Malt Madeline Calvete
Bought by
Calvete Malt Trust and Malt
Current Estimated Value
Purchase Details
Closed on
Sep 1, 2010
Sold by
Douglass Madeline
Bought by
Douglass Madeline
Home Financials for this Owner
Home Financials are based on the most recent Mortgage that was taken out on this home.
Original Mortgage
$147,500
Interest Rate
4.48%
Mortgage Type
New Conventional
Purchase Details
Closed on
Jan 11, 2002
Sold by
Douglass Madeline and Douglass Douglas Madeline
Bought by
Douglass Madeline
Home Financials for this Owner
Home Financials are based on the most recent Mortgage that was taken out on this home.
Original Mortgage
$20,000
Interest Rate
7.11%
Mortgage Type
Credit Line Revolving
Create a Home Valuation Report for This Property
The Home Valuation Report is an in-depth analysis detailing your home's value as well as a comparison with similar homes in the area
Home Values in the Area
Average Home Value in this Area
Purchase History
| Date | Buyer | Sale Price | Title Company |
|---|---|---|---|
| Calvete Malt Trust | -- | None Listed On Document | |
| Douglass Madeline | -- | Chicago Title Servicelink Di | |
| Douglass Madeline | -- | Southland Title Company |
Source: Public Records
Mortgage History
| Date | Status | Borrower | Loan Amount |
|---|---|---|---|
| Previous Owner | Douglass Madeline | $147,500 | |
| Previous Owner | Douglass Madeline | $20,000 |
Source: Public Records
Tax History Compared to Growth
Tax History
| Year | Tax Paid | Tax Assessment Tax Assessment Total Assessment is a certain percentage of the fair market value that is determined by local assessors to be the total taxable value of land and additions on the property. | Land | Improvement |
|---|---|---|---|---|
| 2025 | $4,119 | $384,129 | $159,674 | $224,455 |
| 2024 | $4,119 | $376,598 | $156,544 | $220,054 |
| 2023 | $4,013 | $369,214 | $153,474 | $215,740 |
| 2022 | $3,933 | $361,975 | $150,465 | $211,510 |
| 2021 | $3,841 | $354,878 | $147,515 | $207,363 |
| 2020 | $3,819 | $351,240 | $146,003 | $205,237 |
| 2019 | $3,735 | $344,353 | $143,140 | $201,213 |
| 2018 | $3,668 | $337,601 | $140,333 | $197,268 |
| 2017 | $3,592 | $330,982 | $137,582 | $193,400 |
| 2016 | $3,436 | $324,493 | $134,885 | $189,608 |
| 2015 | $3,386 | $319,619 | $132,859 | $186,760 |
| 2014 | $3,321 | $313,359 | $130,257 | $183,102 |
Source: Public Records
Map
Nearby Homes
- 14612 Highcrest Cir
- 4862 Gainsport Cir
- 45 Golden Glen St Unit 75
- 32 Kazan St Unit 18
- 20 Sacramento Unit 10
- 15071 Talley St
- 10 Raleigh
- 26 Helena Unit 69
- 14942 Dahlquist Rd
- 15202 Marne Cir
- 27 Cheyenne Unit 69
- 5151 Walnut Ave Unit 34
- 14851 Jeffrey Rd Unit 246
- 14851 Jeffrey Rd Unit 61
- 14851 Jeffrey Rd Unit 25
- 14851 Jeffrey Rd Unit 352
- 14851 Jeffrey Rd Unit 248
- 14851 Jeffrey Rd Unit 350
- 14851 Jeffrey Rd Unit 145
- 14851 Jeffrey Rd Unit 199
- 4832 Lindstrom Ave
- 4802 Lindstrom Ave
- 4842 Lindstrom Ave
- 4825 Winvale Ave
- 4792 Lindstrom Ave
- 4821 Winvale Ave
- 4831 Winvale Ave
- 4811 Winvale Ave
- 4852 Lindstrom Ave
- 4782 Lindstrom Ave
- 4841 Winvale Ave
- 4821 Lindstrom Ave
- 4831 Lindstrom Ave
- 4811 Lindstrom Ave
- 4801 Winvale Ave
- 4801 Lindstrom Ave
- 4841 Lindstrom Ave
- 4862 Lindstrom Ave
- 4772 Lindstrom Ave
- 4851 Winvale Ave