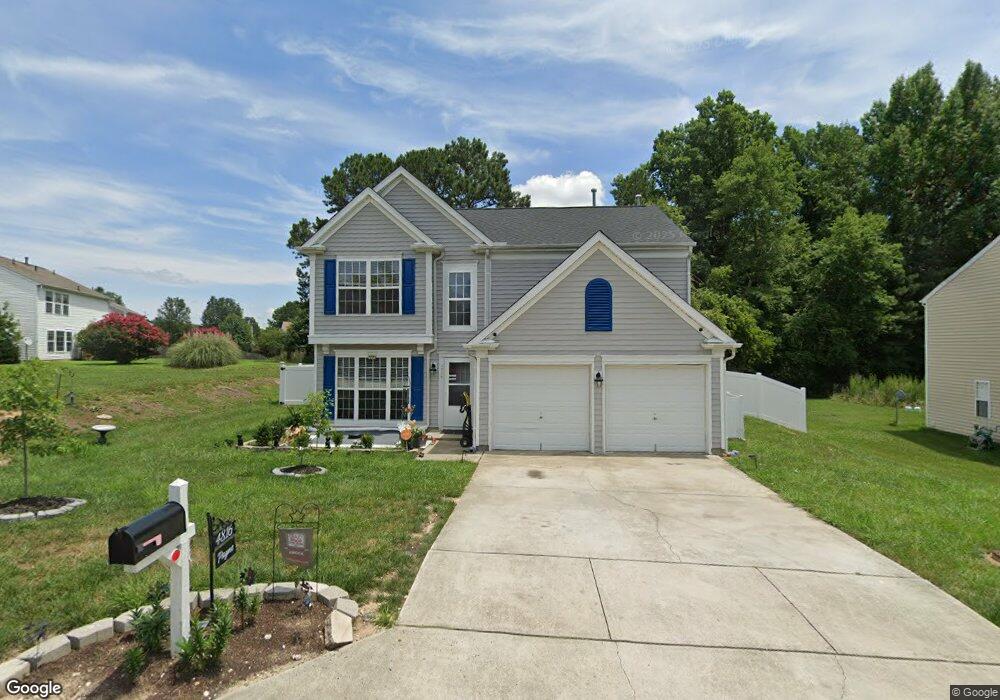
4816 Loganshire Ln Raleigh, NC 27616
Northeast Raleigh NeighborhoodEstimated Value: $360,000 - $377,000
4
Beds
3
Baths
1,775
Sq Ft
$208/Sq Ft
Est. Value
About This Home
This home is located at 4816 Loganshire Ln, Raleigh, NC 27616 and is currently estimated at $369,677, approximately $208 per square foot. 4816 Loganshire Ln is a home located in Wake County with nearby schools including Sanford Creek Elementary School, River Bend Middle, and Rolesville High School.
Ownership History
Date
Name
Owned For
Owner Type
Purchase Details
Closed on
Nov 21, 2019
Sold by
Equity Trust Company
Bought by
Payne Michael and Payne Juanita
Current Estimated Value
Home Financials for this Owner
Home Financials are based on the most recent Mortgage that was taken out on this home.
Original Mortgage
$242,800
Outstanding Balance
$213,601
Interest Rate
3.6%
Mortgage Type
VA
Estimated Equity
$156,076
Purchase Details
Closed on
Jun 7, 2019
Sold by
Woods Kwame Kamala and Alston Dawn S
Bought by
Stars Properties Llc and Equity Turst Company
Purchase Details
Closed on
Jan 20, 2006
Sold by
Woods Kwame Kamala and Aiston Dawn Shanta
Bought by
Woods Kwame Kamala
Purchase Details
Closed on
Nov 17, 1999
Sold by
Pulte Home Corporation
Bought by
Woods Kwame Kamala and Alston Dawn S
Home Financials for this Owner
Home Financials are based on the most recent Mortgage that was taken out on this home.
Original Mortgage
$142,332
Interest Rate
7.81%
Mortgage Type
FHA
Create a Home Valuation Report for This Property
The Home Valuation Report is an in-depth analysis detailing your home's value as well as a comparison with similar homes in the area
Home Values in the Area
Average Home Value in this Area
Purchase History
| Date | Buyer | Sale Price | Title Company |
|---|---|---|---|
| Payne Michael | $243,000 | None Available | |
| Payne Michael | $243,000 | None Listed On Document | |
| Stars Properties Llc | $194,250 | None Available | |
| Woods Kwame Kamala | -- | None Available | |
| Woods Kwame Kamala | $144,000 | -- |
Source: Public Records
Mortgage History
| Date | Status | Borrower | Loan Amount |
|---|---|---|---|
| Open | Payne Michael | $242,800 | |
| Closed | Payne Michael | $242,800 | |
| Previous Owner | Woods Kwame Kamala | $142,332 |
Source: Public Records
Tax History Compared to Growth
Tax History
| Year | Tax Paid | Tax Assessment Tax Assessment Total Assessment is a certain percentage of the fair market value that is determined by local assessors to be the total taxable value of land and additions on the property. | Land | Improvement |
|---|---|---|---|---|
| 2025 | $3,137 | $357,365 | $110,000 | $247,365 |
| 2024 | $3,124 | $357,365 | $110,000 | $247,365 |
| 2023 | $2,586 | $235,382 | $52,000 | $183,382 |
| 2022 | $2,403 | $235,382 | $52,000 | $183,382 |
| 2021 | $2,310 | $235,382 | $52,000 | $183,382 |
| 2020 | $2,268 | $235,382 | $52,000 | $183,382 |
| 2019 | $2,002 | $171,021 | $36,000 | $135,021 |
| 2018 | $1,889 | $171,021 | $36,000 | $135,021 |
| 2017 | $1,799 | $171,021 | $36,000 | $135,021 |
| 2016 | $1,762 | $171,021 | $36,000 | $135,021 |
| 2015 | $1,789 | $170,791 | $36,000 | $134,791 |
| 2014 | -- | $170,791 | $36,000 | $134,791 |
Source: Public Records
Map
Nearby Homes
- 4800 Arbor Lodge Dr
- 5325 Marthonna Way
- 4821 Heathshire Dr
- 5012 Silverdene St
- 5208 Windmere Chase Dr
- 4416 Walker Hallow St
- 4508 Brintons Cottage St
- 4440 Cardinal Grove Blvd
- 4416 Brintons Cottage St
- 4809 Kaycee Ct
- 4348 Karlbrook Ln
- 4236 Saubranch Hill St
- 4252 Rockdell Hall St
- 4139 Davis Meadow St
- 5200 Fieldwood Ct
- 5525 Buffaloe Rd
- 4809 Elmhurst Ridge Ct
- 5915 River Landings Dr
- 5321 Glass Ridge Rd
- 4416 Major Loring Way
- 4812 Loganshire Ln
- 4820 Loganshire Ln
- 4821 Cardinal Grove Blvd
- 4809 Castle Crest Ct
- 4808 Loganshire Ln
- 4901 Cardinal Grove Blvd
- #119 Cardinal Grove Blvd
- 113 Cardinal Grove Blvd
- #124 Cardinal Grove Blvd
- #89 Cardinal Grove Blvd
- #107 Cardinal Grove Blvd
- #117 Cardinal Grove Blvd
- #123 Cardinal Grove Blvd
- #120 Cardinal Grove Blvd
- 4817 Loganshire Ln
- 4817 Cardinal Grove Blvd
- 4804 Loganshire Ln
- 4905 Cardinal Grove Blvd
- 4805 Loganshire Ln
- 4900 Cardinal Grove Blvd