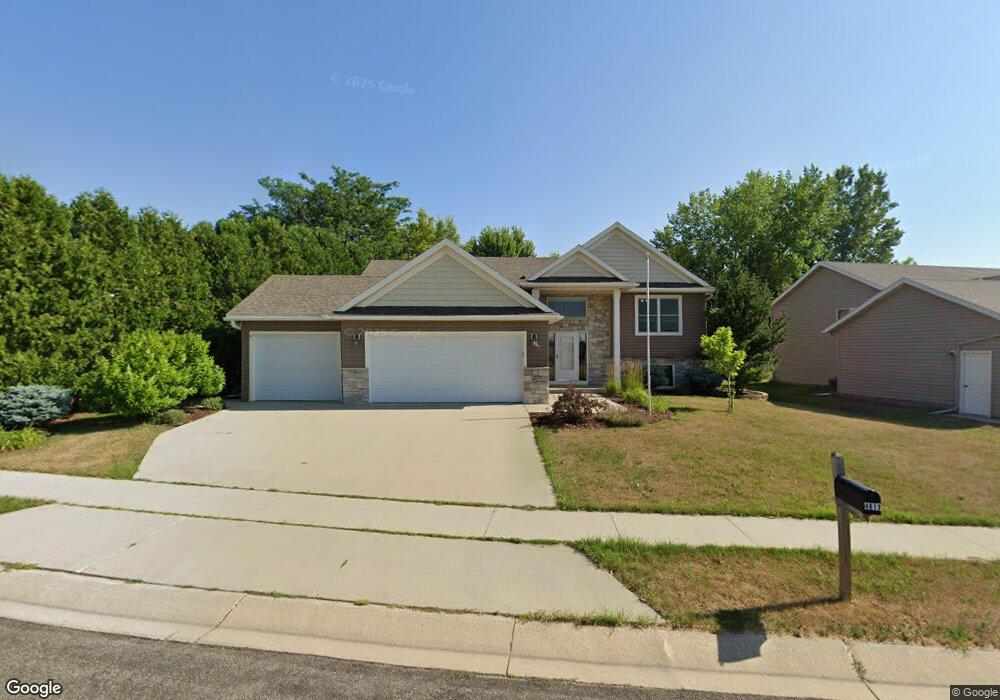
4817 Manor Point Ln NW Rochester, MN 55901
The Manor NeighborhoodEstimated Value: $430,000 - $484,516
3
Beds
2
Baths
1,511
Sq Ft
$308/Sq Ft
Est. Value
About This Home
This home is located at 4817 Manor Point Ln NW, Rochester, MN 55901 and is currently estimated at $464,879, approximately $307 per square foot. 4817 Manor Point Ln NW is a home located in Olmsted County with nearby schools including Bishop Elementary School, John Adams Middle School, and John Marshall Senior High School.
Ownership History
Date
Name
Owned For
Owner Type
Purchase Details
Closed on
May 25, 2010
Sold by
Bigelow Joel and Sons Enterprises Inc
Bought by
Timmer Garrison R
Current Estimated Value
Home Financials for this Owner
Home Financials are based on the most recent Mortgage that was taken out on this home.
Original Mortgage
$185,000
Outstanding Balance
$124,423
Interest Rate
5.12%
Mortgage Type
New Conventional
Estimated Equity
$340,456
Purchase Details
Closed on
Nov 9, 2009
Sold by
Forbrook Bigelow Development Llc
Bought by
Joel Bigelow & Sons Enterprises
Home Financials for this Owner
Home Financials are based on the most recent Mortgage that was taken out on this home.
Original Mortgage
$2,000,000
Interest Rate
4.96%
Mortgage Type
Credit Line Revolving
Create a Home Valuation Report for This Property
The Home Valuation Report is an in-depth analysis detailing your home's value as well as a comparison with similar homes in the area
Home Values in the Area
Average Home Value in this Area
Purchase History
| Date | Buyer | Sale Price | Title Company |
|---|---|---|---|
| Timmer Garrison R | $245,000 | None Available | |
| Joel Bigelow & Sons Enterprises | -- | None Available |
Source: Public Records
Mortgage History
| Date | Status | Borrower | Loan Amount |
|---|---|---|---|
| Open | Timmer Garrison R | $185,000 | |
| Previous Owner | Joel Bigelow & Sons Enterprises | $2,000,000 |
Source: Public Records
Tax History Compared to Growth
Tax History
| Year | Tax Paid | Tax Assessment Tax Assessment Total Assessment is a certain percentage of the fair market value that is determined by local assessors to be the total taxable value of land and additions on the property. | Land | Improvement |
|---|---|---|---|---|
| 2024 | $6,058 | $438,900 | $50,000 | $388,900 |
| 2023 | $5,180 | $411,500 | $50,000 | $361,500 |
| 2022 | $4,910 | $388,900 | $50,000 | $338,900 |
| 2021 | $4,582 | $354,400 | $40,000 | $314,400 |
| 2020 | $4,692 | $338,500 | $40,000 | $298,500 |
| 2019 | $4,392 | $333,000 | $40,000 | $293,000 |
| 2018 | $4,078 | $314,900 | $40,000 | $274,900 |
| 2017 | $3,844 | $307,900 | $40,000 | $267,900 |
| 2016 | $3,264 | $261,500 | $38,200 | $223,300 |
| 2015 | $3,062 | $216,500 | $37,200 | $179,300 |
| 2014 | $3,034 | $216,500 | $37,200 | $179,300 |
| 2012 | -- | $211,300 | $37,070 | $174,230 |
Source: Public Records
Map
Nearby Homes
- 4992 4th St NW
- 828 Diamond Ridge Ln NW
- 4339 Manor Park Dr NW
- 4822 3rd St NW
- 4444 3rd St NW
- 4541 Ruby Ln NW
- 4036 3rd St NW
- 3938 7th St NW
- 3740 8th St NW
- 650 36th Ave NW
- 660 36th Ave NW
- 3586 6th St NW
- 3555 6th St NW
- 4119 Manor View Dr NW
- 4700 Country Club Rd SW
- 5470 Saint Mary Dr NW
- 468 Panorama Cir NW
- 3415 Lake St NW
- 700 Panorama Cir NW
- 3304 Lake St NW
- 4813 Manor Point Ln NW
- 492 Manor Ridge Dr NW
- 4812 5th St NW
- 4809 Manor Point Ln NW
- 4806 5th St NW
- 4818 5th St NW
- 4720 5th St NW
- 481 Manor Garden Ln NW
- 488 Manor Ridge Dr NW
- 4818 Manor Point Ln NW
- 4805 Manor Point Ln NW
- 4714 5th St NW
- 475 Manor Garden Ln NW
- 484 Manor Ridge Dr NW
- 493 Manor Ridge Dr NW
- 4706 5th St NW
- 489 Manor Ridge Dr NW
- 497 Manor Ridge Dr NW
- 4801 Manor Point Ln NW
- 4802 Manor Point Ln NW