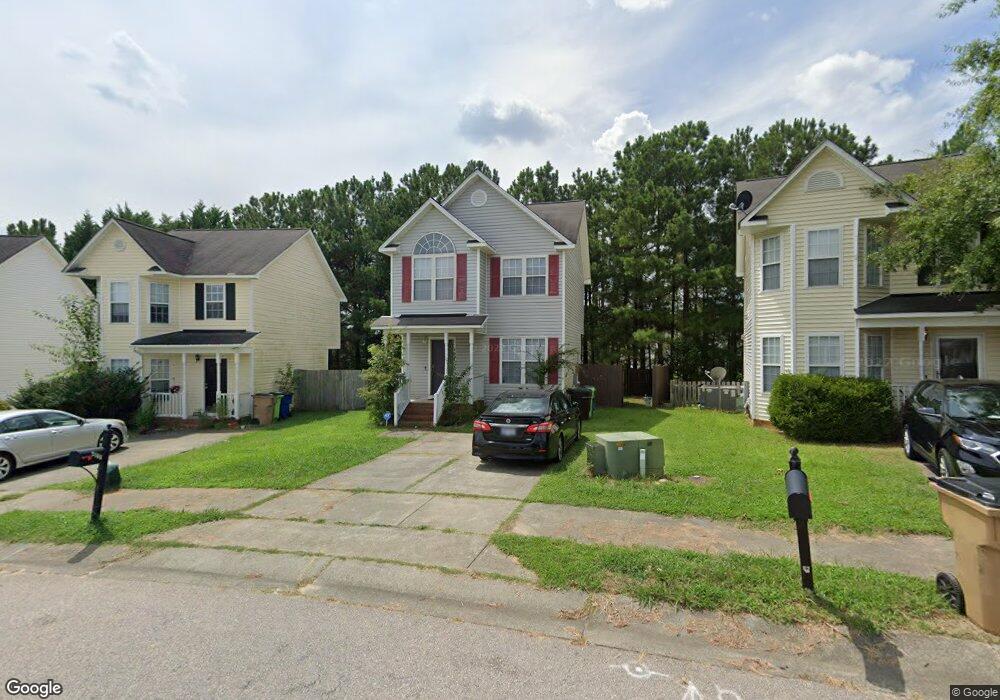
4817 Windbreak Ln Raleigh, NC 27616
Northeast Raleigh NeighborhoodEstimated Value: $252,000 - $279,000
3
Beds
3
Baths
1,097
Sq Ft
$243/Sq Ft
Est. Value
About This Home
This home is located at 4817 Windbreak Ln, Raleigh, NC 27616 and is currently estimated at $266,432, approximately $242 per square foot. 4817 Windbreak Ln is a home located in Wake County with nearby schools including River Bend Elementary, River Bend Middle, and Rolesville High School.
Ownership History
Date
Name
Owned For
Owner Type
Purchase Details
Closed on
Nov 20, 2020
Sold by
Do Khanh and Do Amy
Bought by
Shores Tyler
Current Estimated Value
Home Financials for this Owner
Home Financials are based on the most recent Mortgage that was taken out on this home.
Original Mortgage
$179,685
Outstanding Balance
$159,894
Interest Rate
2.8%
Mortgage Type
New Conventional
Estimated Equity
$106,538
Purchase Details
Closed on
Mar 14, 2017
Sold by
Holley Quentine J and Holley Shawnda Johnson
Bought by
Do Khanh
Purchase Details
Closed on
Dec 27, 2000
Sold by
Sappah Brothers Inc
Bought by
Holley Quentine J and Johnson Shawnda
Home Financials for this Owner
Home Financials are based on the most recent Mortgage that was taken out on this home.
Original Mortgage
$100,400
Interest Rate
7.75%
Purchase Details
Closed on
Jul 27, 2000
Sold by
Carlton Group Of North Carolina Llc
Bought by
Sappah Brothers Inc
Home Financials for this Owner
Home Financials are based on the most recent Mortgage that was taken out on this home.
Original Mortgage
$49,431
Interest Rate
8.23%
Mortgage Type
Seller Take Back
Create a Home Valuation Report for This Property
The Home Valuation Report is an in-depth analysis detailing your home's value as well as a comparison with similar homes in the area
Home Values in the Area
Average Home Value in this Area
Purchase History
| Date | Buyer | Sale Price | Title Company |
|---|---|---|---|
| Shores Tyler | $183,000 | None Available | |
| Do Khanh | $127,000 | None Available | |
| Holley Quentine J | $102,000 | -- | |
| Sappah Brothers Inc | $28,000 | -- |
Source: Public Records
Mortgage History
| Date | Status | Borrower | Loan Amount |
|---|---|---|---|
| Open | Shores Tyler | $179,685 | |
| Previous Owner | Holley Quentine J | $100,400 | |
| Previous Owner | Sappah Brothers Inc | $49,431 |
Source: Public Records
Tax History
| Year | Tax Paid | Tax Assessment Tax Assessment Total Assessment is a certain percentage of the fair market value that is determined by local assessors to be the total taxable value of land and additions on the property. | Land | Improvement |
|---|---|---|---|---|
| 2025 | $2,403 | $273,273 | $90,000 | $183,273 |
| 2024 | $2,393 | $273,273 | $90,000 | $183,273 |
Source: Public Records
Map
Nearby Homes
- 4720 Valley Stream Dr
- 4721 Mocha Ln
- 4522 Centrebrook Cir
- 4701 Tommans Trail
- 4828 Mocha Ln
- 4225 Fowler Ridge Dr
- 4325 Woodlawn Dr
- 4737 Waterford Cove Dr
- 4715 Jelynn St
- 4200 James Rd
- 4217 James Rd
- 4106 N New Hope Rd
- 4200 James
- 5009 Marathon Ln
- 4809 Kaycee Ct
- 4809 Arbor Chase Dr
- 4604 Lavista Ct Unit A & B
- 3712 Old Coach Rd
- 4010 Charleston Park Dr
- 5016 Kyle Dr
- 4821 Windbreak Ln
- 4813 Windbreak Ln
- 4809 Windbreak Ln
- 4829 Windbreak Ln
- 4816 Windbreak Ln
- 4805 Windbreak Ln
- 4800 Windbreak Ln
- 365 Windbreak Ln
- 330 Windbreak Ln
- 295 Windbreak Ln
- 345 Windbreak Ln
- 340 Windbreak Ln
- 290 Windbreak Ln
- 315 Windbreak Ln
- 360 Windbreak Ln
- 320 Windbreak Ln
- 300 Windbreak Ln
- 310 Windbreak Ln
- 111 Windbreak Ln
- 335 Windbreak Ln
Your Personal Tour Guide
Ask me questions while you tour the home.