4819 298th St Toledo, OH 43611
Point Place NeighborhoodEstimated Value: $145,000 - $153,000
3
Beds
1
Bath
1,157
Sq Ft
$129/Sq Ft
Est. Value
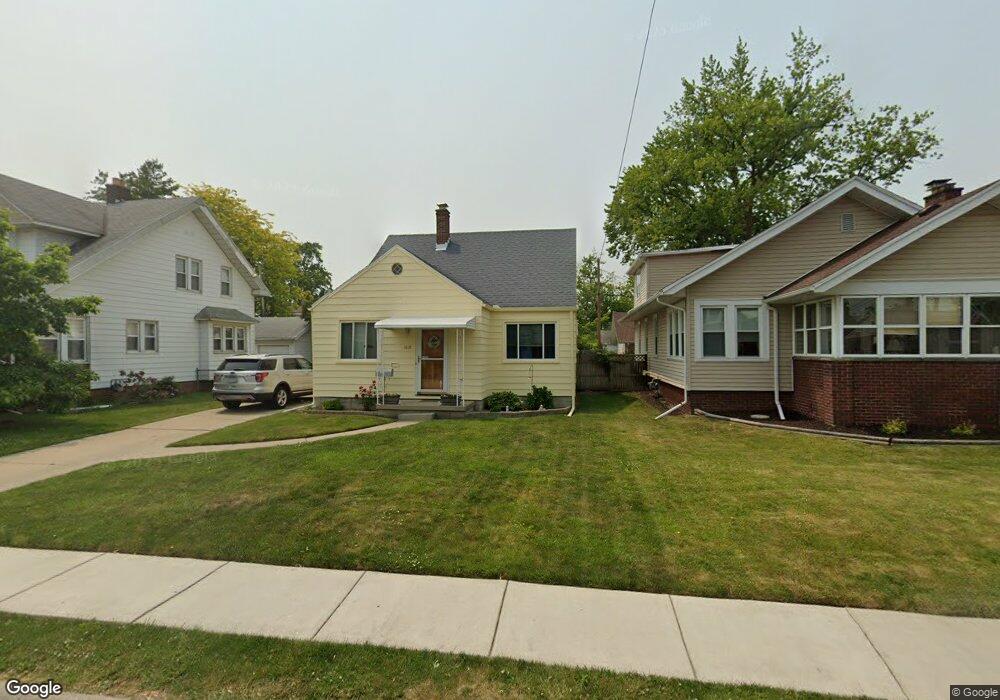
About This Home
This home is located at 4819 298th St, Toledo, OH 43611 and is currently estimated at $149,136, approximately $128 per square foot. 4819 298th St is a home located in Lucas County with nearby schools including Ottawa River Elementary School, Woodward High School, and Imagine Environmental Science Academy.
Ownership History
Date
Name
Owned For
Owner Type
Purchase Details
Closed on
Oct 28, 2005
Sold by
Groenleer Robert B
Bought by
Hartford Amanda A
Current Estimated Value
Home Financials for this Owner
Home Financials are based on the most recent Mortgage that was taken out on this home.
Original Mortgage
$90,000
Interest Rate
5.89%
Mortgage Type
Fannie Mae Freddie Mac
Purchase Details
Closed on
May 18, 2001
Sold by
Neal Rhodes
Bought by
Groenleer Robert B
Home Financials for this Owner
Home Financials are based on the most recent Mortgage that was taken out on this home.
Original Mortgage
$53,400
Interest Rate
7.02%
Purchase Details
Closed on
Nov 23, 1993
Sold by
Wyatt Michael C and Wyatt Donna M
Purchase Details
Closed on
Nov 6, 1991
Sold by
Russell Genevieve F
Create a Home Valuation Report for This Property
The Home Valuation Report is an in-depth analysis detailing your home's value as well as a comparison with similar homes in the area
Home Values in the Area
Average Home Value in this Area
Purchase History
| Date | Buyer | Sale Price | Title Company |
|---|---|---|---|
| Hartford Amanda A | $90,000 | -- | |
| Groenleer Robert B | $83,400 | -- | |
| -- | $63,000 | -- | |
| -- | $56,900 | -- |
Source: Public Records
Mortgage History
| Date | Status | Borrower | Loan Amount |
|---|---|---|---|
| Previous Owner | Hartford Amanda A | $90,000 | |
| Previous Owner | Groenleer Robert B | $53,400 |
Source: Public Records
Tax History
| Year | Tax Paid | Tax Assessment Tax Assessment Total Assessment is a certain percentage of the fair market value that is determined by local assessors to be the total taxable value of land and additions on the property. | Land | Improvement |
|---|---|---|---|---|
| 2025 | -- | $28,875 | $8,295 | $20,580 |
| 2024 | $893 | $28,875 | $8,295 | $20,580 |
| 2023 | $1,748 | $27,160 | $7,350 | $19,810 |
| 2022 | $2,007 | $27,160 | $7,350 | $19,810 |
| 2021 | $2,047 | $27,160 | $7,350 | $19,810 |
| 2020 | $2,174 | $25,795 | $5,530 | $20,265 |
| 2019 | $2,121 | $25,795 | $5,530 | $20,265 |
| 2018 | $2,012 | $25,795 | $5,530 | $20,265 |
| 2017 | $1,918 | $25,200 | $5,390 | $19,810 |
| 2016 | $1,914 | $72,000 | $15,400 | $56,600 |
| 2015 | $1,896 | $72,000 | $15,400 | $56,600 |
| 2014 | $1,585 | $25,200 | $5,390 | $19,810 |
| 2013 | $1,585 | $25,200 | $5,390 | $19,810 |
Source: Public Records
Map
Nearby Homes