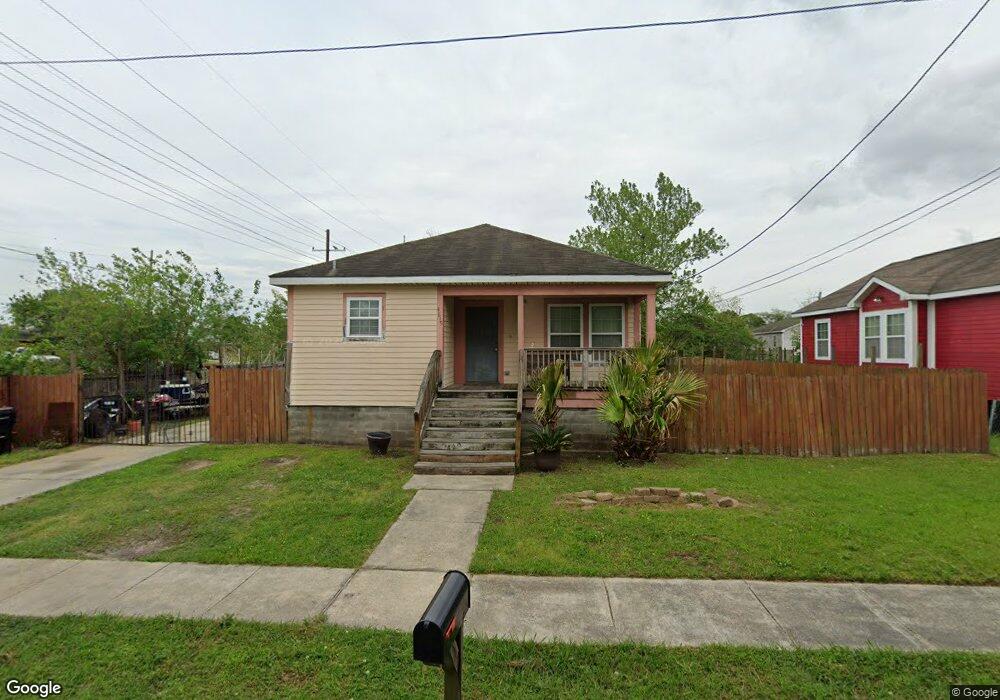
4819 Reynes St New Orleans, LA 70126
Plum Orchard NeighborhoodEstimated Value: $98,574 - $138,000
--
Bed
--
Bath
1,040
Sq Ft
$115/Sq Ft
Est. Value
About This Home
This home is located at 4819 Reynes St, New Orleans, LA 70126 and is currently estimated at $119,144, approximately $114 per square foot. 4819 Reynes St is a home located in Orleans Parish with nearby schools including KIPP East Community Primary, KIPP Morial, and Mary Bethune Elementary School.
Ownership History
Date
Name
Owned For
Owner Type
Purchase Details
Closed on
Jul 15, 2009
Sold by
New Orleans Habitat Human
Bought by
Galloway Crystal M
Current Estimated Value
Home Financials for this Owner
Home Financials are based on the most recent Mortgage that was taken out on this home.
Original Mortgage
$26,000
Outstanding Balance
$17,038
Interest Rate
5.39%
Estimated Equity
$102,106
Create a Home Valuation Report for This Property
The Home Valuation Report is an in-depth analysis detailing your home's value as well as a comparison with similar homes in the area
Home Values in the Area
Average Home Value in this Area
Purchase History
| Date | Buyer | Sale Price | Title Company |
|---|---|---|---|
| Galloway Crystal M | $76,000 | -- |
Source: Public Records
Mortgage History
| Date | Status | Borrower | Loan Amount |
|---|---|---|---|
| Open | Galloway Crystal M | $26,000 | |
| Closed | Galloway Crystal M | $26,000 |
Source: Public Records
Tax History Compared to Growth
Tax History
| Year | Tax Paid | Tax Assessment Tax Assessment Total Assessment is a certain percentage of the fair market value that is determined by local assessors to be the total taxable value of land and additions on the property. | Land | Improvement |
|---|---|---|---|---|
| 2025 | $212 | $10,430 | $1,800 | $8,630 |
| 2024 | $1,005 | $10,430 | $1,800 | $8,630 |
| 2023 | $80 | $6,460 | $1,350 | $5,110 |
| 2022 | $80 | $6,200 | $1,350 | $4,850 |
| 2021 | $84 | $6,460 | $1,350 | $5,110 |
| 2020 | $84 | $6,460 | $1,350 | $5,110 |
| 2019 | $81 | $6,240 | $1,130 | $5,110 |
| 2018 | $81 | $6,240 | $1,130 | $5,110 |
| 2017 | $65 | $6,240 | $1,130 | $5,110 |
| 2016 | $65 | $6,240 | $1,130 | $5,110 |
| 2015 | $64 | $6,080 | $1,130 | $4,950 |
| 2014 | -- | $6,080 | $1,130 | $4,950 |
| 2013 | -- | $6,080 | $1,130 | $4,950 |
Source: Public Records
Map
Nearby Homes