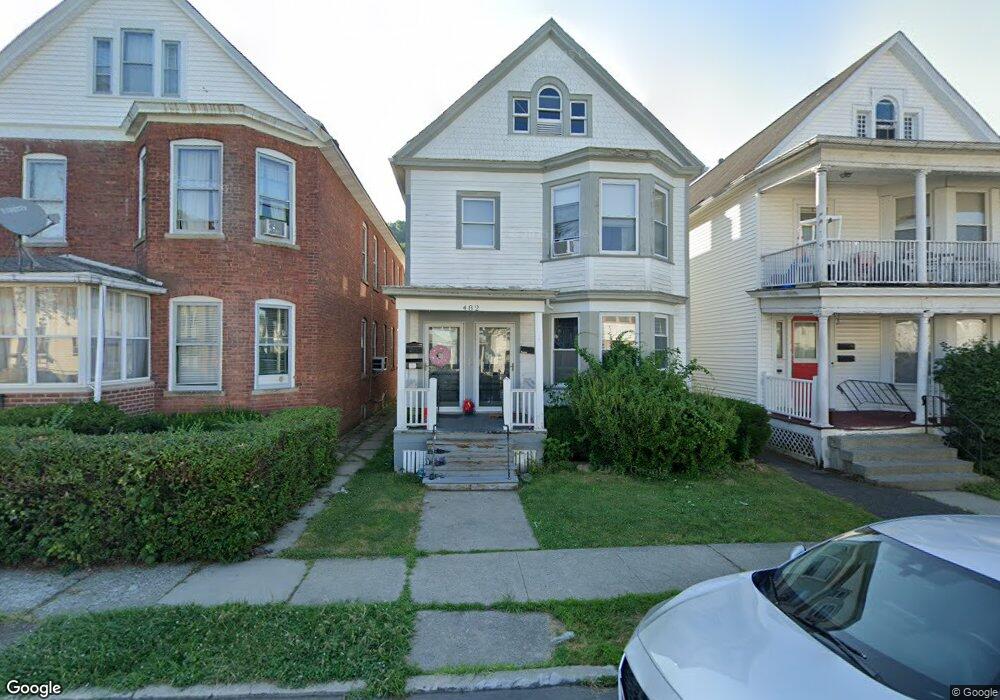
482 8th Ave Unit 2 Troy, NY 12182
Lansingburgh NeighborhoodEstimated Value: $218,000 - $243,606
3
Beds
1
Bath
2,152
Sq Ft
$107/Sq Ft
Est. Value
About This Home
This home is located at 482 8th Ave Unit 2, Troy, NY 12182 and is currently estimated at $229,902, approximately $106 per square foot. 482 8th Ave Unit 2 is a home located in Rensselaer County with nearby schools including Turnpike Elementary School, Rensselaer Park Elementary School, and Knickerbacker Middle School.
Ownership History
Date
Name
Owned For
Owner Type
Purchase Details
Closed on
Dec 27, 2024
Sold by
Canty Dominick
Bought by
Weekes Joslyn J
Current Estimated Value
Home Financials for this Owner
Home Financials are based on the most recent Mortgage that was taken out on this home.
Original Mortgage
$218,500
Outstanding Balance
$216,593
Interest Rate
6.81%
Mortgage Type
Purchase Money Mortgage
Estimated Equity
$13,309
Purchase Details
Closed on
Sep 13, 2018
Sold by
Curcio Anthony T and Wood Stacy L
Bought by
Canty Dominick
Home Financials for this Owner
Home Financials are based on the most recent Mortgage that was taken out on this home.
Original Mortgage
$127,645
Interest Rate
4.5%
Mortgage Type
FHA
Create a Home Valuation Report for This Property
The Home Valuation Report is an in-depth analysis detailing your home's value as well as a comparison with similar homes in the area
Home Values in the Area
Average Home Value in this Area
Purchase History
| Date | Buyer | Sale Price | Title Company |
|---|---|---|---|
| Weekes Joslyn J | $230,000 | None Available | |
| Weekes Joslyn J | $230,000 | None Available | |
| Weekes Joslyn J | $230,000 | None Available | |
| Canty Dominick | $130,000 | -- | |
| Canty Dominick | $130,000 | -- | |
| Canty Dominick | $130,000 | -- |
Source: Public Records
Mortgage History
| Date | Status | Borrower | Loan Amount |
|---|---|---|---|
| Open | Weekes Joslyn J | $218,500 | |
| Closed | Weekes Joslyn J | $218,500 | |
| Previous Owner | Canty Dominick | $127,645 |
Source: Public Records
Tax History
| Year | Tax Paid | Tax Assessment Tax Assessment Total Assessment is a certain percentage of the fair market value that is determined by local assessors to be the total taxable value of land and additions on the property. | Land | Improvement |
|---|---|---|---|---|
| 2024 | $4,798 | $105,000 | $9,200 | $95,800 |
| 2023 | $4,704 | $105,000 | $9,200 | $95,800 |
| 2022 | $4,579 | $105,000 | $9,200 | $95,800 |
| 2021 | $1,196 | $105,000 | $9,200 | $95,800 |
| 2020 | $2,164 | $105,000 | $9,200 | $95,800 |
| 2019 | $3,257 | $105,000 | $9,200 | $95,800 |
| 2018 | $3,257 | $105,000 | $9,200 | $95,800 |
| 2017 | $3,215 | $105,000 | $9,200 | $95,800 |
| 2016 | $4,346 | $105,000 | $9,200 | $95,800 |
| 2015 | -- | $105,000 | $9,200 | $95,800 |
| 2014 | -- | $105,000 | $9,200 | $95,800 |
Source: Public Records
Map
Nearby Homes
Your Personal Tour Guide
Ask me questions while you tour the home.